
Author: Martin Coomber

Better Tools 5: Managing Feedback in Word Documents

SmartExtract is a tool that extracts revisions, comments and similar feedback made by others into a table so that you can review and respond to them.

The table includes the context of the change so you can interpret the feedback, often without needing to refer to the source document.

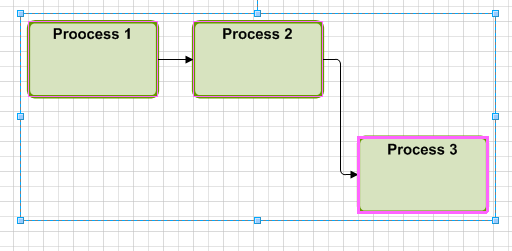
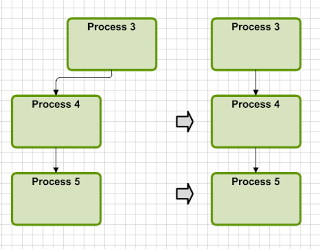
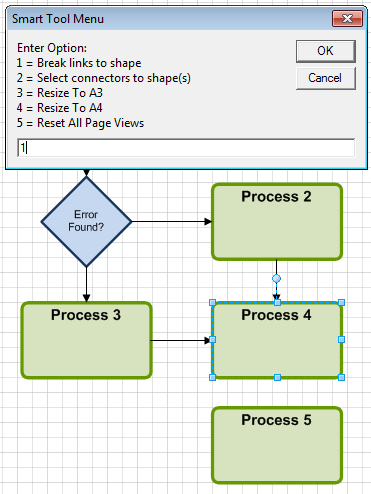
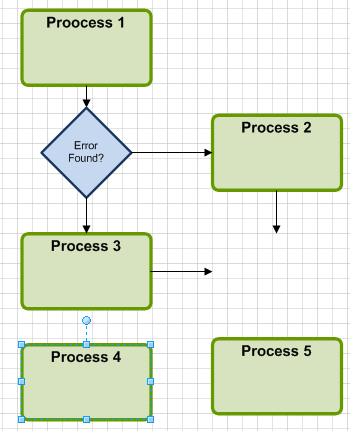
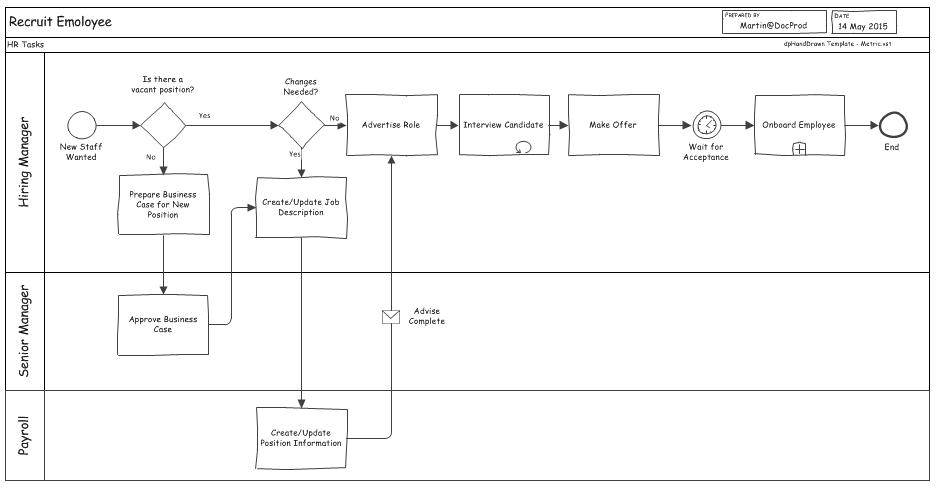
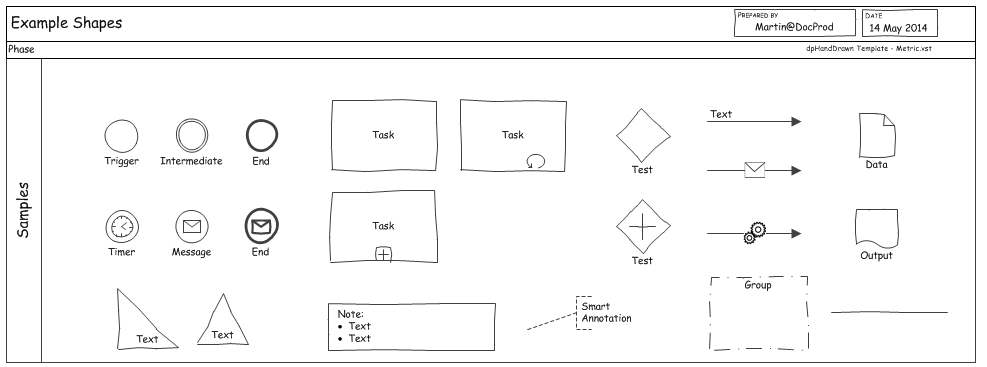
It complements my earlier posts which describe Word tools for quickly recording content into tables, automating the layout of bulleted lists, and a hand drawn process modelling stencil for Visio. The last post was Better Tools 4: Productivity Tools for Process Modelling in Visio, which provides a set of Visio tools to resize and realign shapes in process models.

Smart Extract

SmartExtract allows you to summarize comments and revisions received in a word document. It extracts the feedback into a table that allows quick point-by-point responses that look very professional. Providing detailed responses is a great way to acknowledge the effort reviewers have put in, and using this tool makes it easy.


{module ad 300×100 Large mobile}


By showing each comment or revision in its wider context, your own review of the feedback can be very efficient, allowing you to skim through minor changes and focus on those that are important. If you do need to refer to the source, there is shortcut key that takes you from the summary entry directly to the page in the document where the comment or change occurs.

If there are multiple reviewers, collating a summary of all changes into a single table is a great way to prepare for document review meetings.
If you record placeholders for gaps and highlight areas for rework in your own documents, the tool can also be used to summarise the outstanding work to be done to complete a working draft.

The summary report

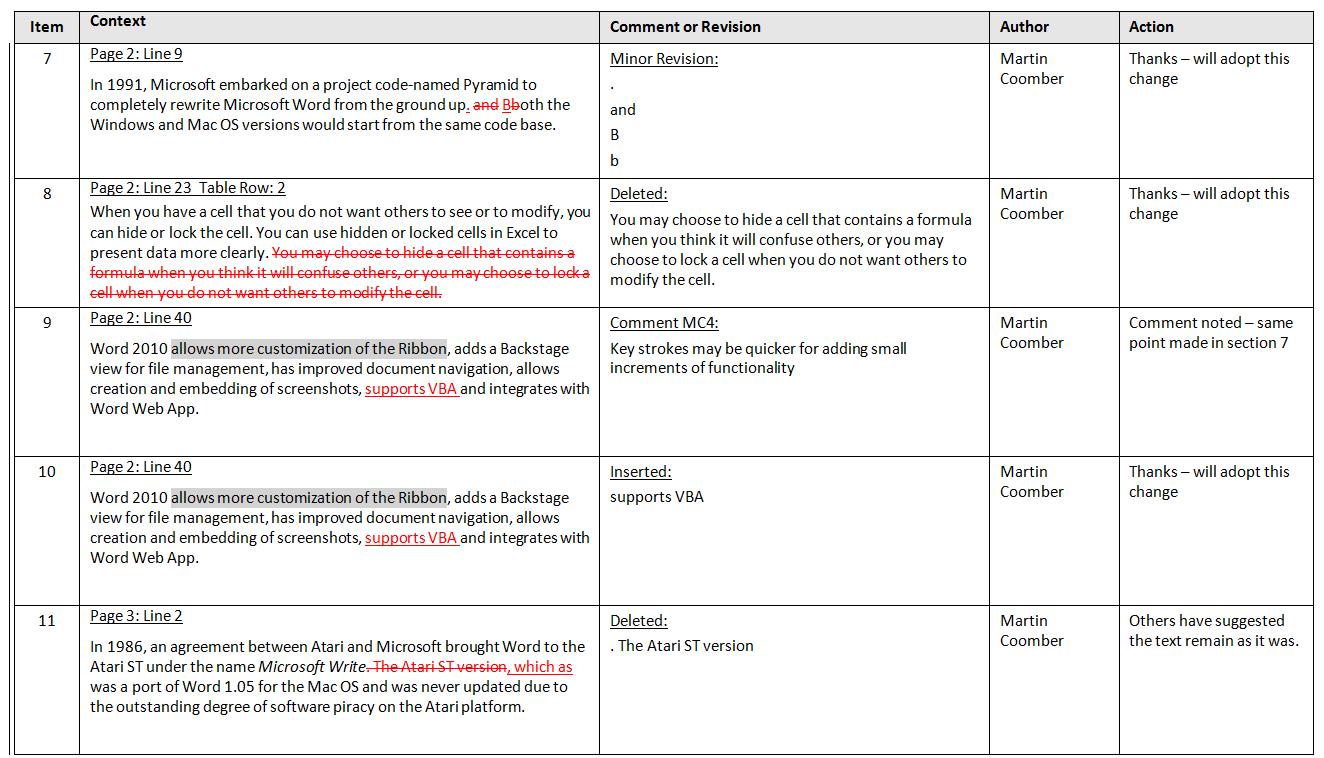
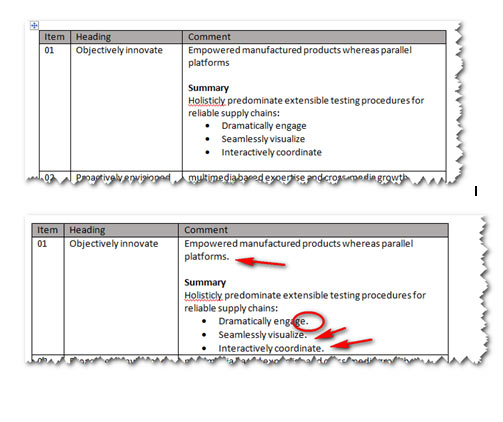
The sample below shows the summary extract. Each change or comment appears in the order it appears in the document and is numbered for easy reference.

coomber1

Context

The context of the change or comment is given, with the specific change or comment highlighted within it. In most cases, the context is sufficient to make decisions about the feedback.
If the change or comment is in the body of the document, the context includes the preceding 30-40 words. If the comment or change is in a table, you see the contents of the entire cell.

The page and line number of the change or comment are shown, and a reference to the table row in any table is given. If you click into this heading line and press a shortcut key you will be taken directly to the relevant page in the source document to inspect the comment or change further.
Insertion and deletion changes are shown as they are normally seen in track changes, in a different colour and with deletions shown in strikethrough. Comments are shown in grey highlight.

Only insertion and deletion changes are recorded by SmartExtract; formatting changes are ignored.

A single large table can be assembled from several feedback documents returned to you. There are subtle layout rules in the context entry header that allow you to sort on this column and merge all responses into a single correctly ordered list.

Comment or Revision

The text of the change or comment is shown. As well as showing comments and revisions, SmartExtract also includes highlighted text because some reviewers like to use this as a tool to indicate gaps or other areas of concern.

Often a reviewer will make several minor changes, for example, correction of punctuation or change the tense of a phrase. SmartExtract combines minor changes into a single entry for the entire paragraph concerned. Without this, the summary table would contain many distracting low-value entries.

Author

The author column allows revisions from multiple people can be reviewed.

Action

The action column allows you to record responses to the feedback. Since the context and the comment or change are already present, the response does not have to be very lengthy, and in many cases, the same response is copied from entries above, saving a good deal of time.
Inspiration

I frequently receive feedback on the documents I produce. Collating this and responding to it is a real chore. I decided to write this routine after getting 12 sets of feedback on a lengthy document having to present a summary for a review meeting.

The ability to respond point-by-point to feedback is really important for me. In the past, any response I gave had to be very generic because of the effort needed to indicate each change before responding to it. This routine saves hours of effort and allows me to present professional responses very quickly.

Learning about Word and VBA programming

Word stores changes and comments in separate objects. Listing these in a table is fairly straightforward. However, I wanted one list showing all feedback of all types in their natural order. This meant some preprocessing and sorting to get the items in the correct order. I used arrays and a bubble sort to do this.
I also wanted to include the context; this meant determining the location of the feedback item and extracting the surrounding paragraphs. I had to understand and manipulate document and range locations using character and paragraph information. It also had to switch the source document into the correct mode so that the context copy process extracted the text in the correct format.

Another complication was the treatment of minor changes. I wanted to combine these into one entry for each paragraph. This meant pre-reading the upcoming changes, checking their size and collating them if they were minor, then resuming normal processing from the correct point onward.

As is usual with Word programming, special treatment for tables was an extra complication.

Better Tools 4: Productivity Tools for Process Modelling in Visio

This post provides three efficiency tools for process modelling and design work in Visio. They provide quick resizing and realignment tools for groups of shapes and a way of moving shapes without dragging its connectors as it moves.

It complements three earlier posts:

Tool 1: SmartSize

SmartSize allows you to resize a set of shapes by example  and allows them to be quickly selected and resized later.

Using the Tool

First, select the exemplar shape and adjust its size. Then select the other shapes in the set. Finally, press the SmartSize shortcut key. All of the shapes will now be the same as the first one selected.

picture1

In this diagram, Component 2 and Component 3 will be resized to be the same as Component 1

picture2

The three components are now resized and have been assigned a group number so that they can be resized as a group later.

Quickly Resizing Later

Select any member of the group and adjust its size. Then press the SmartSize shortcut key. The rest of the set will be selected. Press the shortcut key again and the set is resized to the first one selected.

picture3

Resize Component 3 then press the shortcut key. The rest of the group is selected.

picture4
Press the shortcut key again and they are now resized.

Whenever a set is resized, each shape is marked internally with a group number. When the shortcut key is used and there is only one shape selected, the tool first selects all the shapes in the same set. When the shortcut key is pressed again the routine carries out the resizing action.

Inspiration

I use this tool whenever I am working in Visio, especially when preparing context diagrams and structural representations. In these diagrams, having consistent shape sizes as the content in each shape is added means regular adjustments. While Visio has some resizing features, they are somewhat hidden and lack the resize by example and group management features seen here.

Learning about Visio

This was the first tool I built in Visio many years ago. It uses many of the shape management concepts that are used for more advanced tools.

The size of a shape is determined by the height and width values that you can see when you view its shapesheet. The tool uses a simple loop to step through the shapes in selection set. It finds the height and width of the first shape and assigns these values to the remaining shapes in the set. The looping, variable handling, and assignment of values to the shapesheet form the basis of most other Visio programming.

Tool 2: SmartAlign

SmartAlign allows you to align a set of shapes by example and allow them to be quickly realigned later.

Using the Tool

Select a shape that has been positioned correctly. Then select the other shapes that should align to it. Then press the SmartSize shortcut key. All the shapes are now aligned through the middle of the first. There is a separate shortcut key for vertical and horizontal alignment.

picture4a
In this diagram Process 3 has moved and Process 1 and Process 2 have been selected for alignment

picture5
Using the shortcut key has realigned the shapes

picvertical
This diagram shows that a similar shortcut key can be used for vertical alignment.  

Quickly Realigning Later

Select any member of the alignment set and move it to its new location. Then press the shortcut key to reselect the rest of the alignment set. Then press the shortcut key again. The set now aligns with the first shape selected.

Whenever a set is aligned, each shape is marked internally with a group number. When the shortcut key is used and there is only one shape selected, the tool selects all the shapes in the same set. When the shortcut key is used again, the routine carries out the alignment action.

Inspiration

I use this tool whenever I am working in Visio, especially when process modelling and preparing framework and structural diagrams. The ability to quickly align and realign the same set of shapes can save a lot of time, especially as the model matures and the layout adapts. The Visio tools for alignment have improved over time, and work reasonably when initially laying out a model. They are not so great for making quick changes later.

Extending SmartAlign: Automatically Selecting Shapes

SmartAlign has an extension which allows you to automatically select shapes to align. This can be used when aligning shapes for the first time, or when you have a group of shapes and want to extend it to include additional items in the same band running across or down the page.

The first time you press the extension shortcut key, the routine selects those shapes that are most closely aligned the first shape selected. Pressing it again widens the selection to include an increasingly broader set of shapes. The fourth press returns you the start point if there are shapes selected that were not intended. There is a separate extension shortcut key for both horizontal and vertical alignment.

Learning about Visio

SmartAlign extends the concepts developed in SmartSize. It shares the looping concepts but adds the ability to programmatically call the Visio functions like alignment that are seen in the UI. A quick way of getting started is to use the macro recorder and then inspect the code that Visio generates itself. Another key feature this routine highlights is the ability to create and manage the content of custom property fields. These fields are used to store the identifiers that define sets used in SmartSize and SmartAlign. When a new group is identified, the internal GUID for first shape in the set is assigned to the property value in each of the others. If the property does not exist, it is created. Later, a routine in the code selects those shapes which have the same attribute as the one selected.  

Tool 3: Break Links

Break Links removes the connections to a shape so that it can be moved without dragging the connectors with it. The end points of the connectors remain in their current location so that another shape can be dropped in its place. Usually, Visio will then automatically link the connectors to the new shape.

tool31
In this diagram, Process 4 has been selected, the Smart Tool Menu shortcut key pressed to show the menu and Break Links selected

tool32
Process 4 has been moved away and Process 5 can be inserted and the connectors linked to it automatically.

Inspiration

I use this tool regularly, especially in the early phases of process modelling when the structure is fluid and changes are frequent. I often need to move a process shape sideways to make room for another. Dragging the shape drags its connectors too, and this can be a pain, so it can be easier to break the connectors before the move.

Learning about Visio

This routine illustrates some key features of one dimensional shapes (connectors). When unconnected to a shape, the start and end coordinates point of a connector are expressed as (x,y) positions, however when connected, these end point s refer to locations on the shape it is connected to (its parent). To break the links, the routine determines the parent location as (x,y) coordinates and assigns these to the end points. This means the connector loses is parent link, but its endpoint remains in the same place.

Better Tools 3: Hand-drawn Process Flows in Visio

This post provides a set of shapes and a template that you can use to create process flows using a hand-drawn style.

It complements two earlier posts:

Hand-drawn Shapes

Using a ha¬¬nd-drawn style helps convey a “work-in-progress” feel that signals informality and encourages discussion.

I often use them to confirm conversations and to model early versions of simple flows aimed at a business audience. They fit between the informal stick figure approach and a formal modelling toolset like BPMN.

Here is a sample of a process modelled using the shapes and template.

coomber May26 IMG001

Most process flows can be expressed using the task and gateway shapes, with the circle shapes used for start and end. In addition, there is a wider palette of shapes that represent a reasonable subset of those used by BPMN. I have found that the shapes in this palette are readily understood by a business audience and that the remainder are too advanced for this informal style of modelling.

Here is the full range of shapes:

coomber May26 IMG002

The shapes can be used in flowcharts and other diagram types, and I have included some triangle shapes for completeness.

Shape Features

The waviness of the shapes simulates a hand-drawn look by breaking up each side into sections that randomly vary off the true straight line. In the case of the circular shapes, the outline is actually a smoothed octagon with a slight randomness built into the location of each of the vertices.

Each shape is subtly different from each other, and in rare instances, the representation can be a bit extreme. Right-clicking the shape provides an to option redraw the shape using a different random distribution.

Right clicking the shape also allows the section of variations within the main shape, for example to reveal the message icon within the start and end shape or the location of an icon on the connector.

coomber May26 IMG003

The colour of the outline is a subtle grey to simulate a pencil outline and the font is comic sans to simulate handwriting. I tend to use the dynamic connector with straight lines because I like the flexible way it handles shape moves. However, I have provided a simple straight line in hand-drawn style for those that need one.

The template provided is based on the standard Visio cross-functional template. It includes a smart audit box for name and date that keeps its position in the top right of the frame as the size of the diagram gets bigger.

Using the ShapeSheet

The ShapeSheet is a Visio function that lets you look at the internal controls that define the shape. It describes its geometry, location, size and style. To view the ShapeSheet, you will have to switch on the developer tab, and then right click on any shape.

If you look at the ShapeSheet for the task shape, you will see a user field called User.sf – the scaling factor. Altering this value changes the waviness of the shape, something you may want to do if enlarging the shape or changing the line thickness for special diagrams. You will also see the geometry that draws the collapsed and loop icons and you will be able to follow the way that Visio uses the right click function to control what parts of the shape are shown.

The circular shapes are also an interesting example of how a shape can be assembled from several components. In this case, it shows an inner circle and a picture, and how to reveal and hide each using values passed from right click feature.

The connector shapes are a good example of how to connect pictures to lines, something that isn’t that obvious.

Inspiration

I got the idea for hand-drawn shapes from The Visio Guy – a site that contains a wealth of Visio shapes, tutorials and community feedback. There, you can find further examples of hand-drawn shapes.

I learned a great deal about managing Visio shapes from this project. I hope you will enjoy using them and perhaps use them as a starting point to your own explorations.

Downloading the Tools

The tools can be downloaded from Document Productivity. At the site you’ll find free downloads for a range of other Word and Visio tools.

Don’t forget to leave your comments below.

Better Tools 2: Automated Punctuation in Microsoft Word

This post describes two tools that automate the formatting and punctuation of tables and bulleted lists in Microsoft Word. It complements and earlier post – Better Tools: Efficient Table Management which described Word tools for quickly recording content into tables and numbering the entries.

A key goal is to demonstrate how Office’s development language can be used to automate manual tasks, and to encourage readers to add the ability to create simple, timesaving macros to their skillset.

A link to a free download of the tools is given at the end of the post.

Setting the scene

As a Business Analyst, I am often required to prepare text-heavy documents such requirement statements, risk assessments, business cases and many others. The content needs to be concise, easily digested by the reader, and quick and easy to prepare.

To meet these objectives, I make extensive use of tables and bulleted lists. Both allow me to quickly capture content, and when I’m on a roll, I often find that I haven’t formatted or punctuated the content correctly. If I slow down and get picky with the presentation, I can lose focus on the ideas and information that I’m trying to capture.

I have developed some tools to help me correct the presentation once I’m ready. I have used VBA, the development tool that comes with Microsoft Office. I’ll describe the tools and mention some of the development concepts that they cover.

Formatting Table Content

This tool puts a “.” character at the end of every paragraph in a selected range of table cells. It does this only when there is no other punctuation character already present.

This means you can dump a bunch of ideas and down in a table and avoid the tedious task of checking each entry and adding the punctuation later. You can select the entire table and process it all with a single key press, and be sure that it won’t change anything you have already entered.

At the same time, it removes blank lines at the end of the selected cells. These blank lines are easy to add accidentally, and can be are hard to spot. If they are not removed they can make row spacing look strange.

In this before and after image, you’ll see that the “.” characters have been added and the blank line at the bottom of the cell removed. The existing punctuation “:” has been retained. 

coomber Img1 Oct28From a coding perspective, this routine is simple demonstration of the way that VBA allows the code to step through a range of cells within a table. It then steps through the paragraphs within a given cell, and then through the characters in a given paragraph. You can use the same concepts to step through a document and check for certain content and make necessary changes. 

The code also shows how to access information about the current position in the table and do things like skipping the content in header rows and in the first column where punctuation is unlikely to be required. Finally, the code shows how to update cell content using text manipulation.

Automatic Punctuation of Bulleted Lists

Apart from making frequent use of tables, another way of efficiently capturing information in text documents is to use bulleted lists. I like to use bulleted lists because the introduction or preceding statement sets the context for the list entries, and means that the reader can focus on the key messages without distraction.

One of the issues I find with bulleted lists is the varying punctuation standards that my clients expect. Some want grammatically correct clauses with semi-colons and use of “and” to make the list a correctly formatted, if somewhat long, sentence. Other clients like “.” characters at the end of each list entry, just want a “.” character at the end of the final entry.

This variation in style causes me two main problems. Firstly, I tend to dump ideas as quickly as I can and have to punctuate correctly later. Secondly, I often like to reorder the entries, so need to change the punctuation, especially if I add an entry at the bottom.

I decided to create a tool that would punctuate the list according to a chosen style, and correct existing punctuation if I chose a different style or change the order of the entries.

The punctuation styles used are:coomberImg2 Oct28

Here is an example of how the tool adds punctuation using a “semi-colon” style. You don’t have to select the list, just place the cursor anywhere in the text and the entire list is selected automatically. coomberImg3 Oct28
coomberImg4 Oct28 Here is an example of how the tool corrects the punctuation when the entry order is changed. Note that the “and” has been moved to its correct location and the final “.” added.

I have built the tool to handle bulleted lists inside tables, so you can apply bulleted list formatting and the fill in any other punctuation using the tool described at the start of this post.

The tool will also handle bulleted lists in documents that use numbered paragraphs, which share many of the internal characteristics of lists.

From a coding perspective, this tool uses some special logic to determine the extent of the bulleted list. Some of the more elegant methods available didn’t handle the complexity of table cell boundaries and the presence of numbered paragraphs, so I settled on a fairly boring but reliable step through each list entry, looking up to determine the start of the list, and looking down to find the end of the list. This approach allows the code to test for table cell boundaries and changes in formatting style.

Once the paragraph numbers that define the boundaries of the list have been determined, the code simply steps through each of them, making changes and adding the punctuation required for the selected style using simple text handling methods. 

To keep things simple, the code strips out all existing punctuation first. This seems a little inefficient but has the virtue of being simple, and the execution is quick enough.

A downside of making these text changes, perhaps unnecessarily, is the potential to create large numbers of change indications if Track Changes is on. I have therefore added logic to temporarily turn off track changes processing when applying the style, and switching it on again afterward.

Conclusion

I use these tools frequently every day, they save me time, and encourage me to make the best use of efficient text entry, and allow me to present this in a consistent and reliable manner with a few keystrokes.

I hope the coding techniques used will provide some useful guidance too.

Downloading the Tools

The table tools can be downloaded (for free) here. You can also find more information on VBA in general, and more specific information on setting the tools up for use. I use them every day, but you should test them thoroughly to ensure that they work for you. Please feel free to adapt the tools to suit your own needs.

Don’t forget to leave your comments below.


Better Tools: Efficient Table Management

As a Business Analyst, I know that models and diagrams are the most effective way of expressing ideas, information, and outcomes. However, no matter how much I use visual content, I am often required to prepare text-heavy documents.

Whether it is requirements statements, business cases, service levels, project reports or dozens of other documents, sometimes I need to prepare written content as efficiently as possible.

To present written content, I try to maximise my use of tables, typically using Microsoft Word. I found the that the standard table tools in Word were not as efficient as I needed, so I set out to address these deficiencies.

This article outlines my thoughts on why tables are so effective, and indicates the improvements that I have made to Word’s table management features. I then describe the techniques I used to build them, and provide a link where you can find further details and copies of each of the tools.

What Tables Offer

From a BA perspective, I believe tables provide the following benefits:

Item Feature Comment
1 Conciseness
  • The limited space in a table drives a focus on recording key information. Unnecessary content is discouraged.
  • Bullet points are encouraged.
  • Short phrases, possibly ungrammatical, can be used.
2 Usability
  • Readers are much more likely to scan a table; large amounts of information can be viewed at a glance.
  • Tables also allow the reader to spot patterns and search for detail that would otherwise be lost in regular text.
  • Tables focus attention onto the key points on the page.
3 Context
  • The column and row headings provide context to table entries that would be lengthy and repetitive to record in regular text.
4 Structure
  • The order of rows and their presence in particular sections conveys important structural information.
  • Numbering rows aids the review process and provides traceability.
5 Speed
  • Tables allow information to be captured and formatted quickly. This is important for BAs working to deadlines.

Renumbering Improvements

For me, the main issue with Word’s standard tools was the lack automated row renumbering. There is real value in having consistently numbered rows, but without some sort of renumbering, inserting a row into an existing numbered table of can be a real pain. For example, when creating a list of requirements, I need to add new entries and move items around. I then want the numbering to adjust accordingly.

In some documents, I need to build several lists, so I need the ability to add a prefix to the numbering in each table, so that across the document as a whole, each entry is unique.

Sometimes I need to reliably lock down the numbering in a given table so that new entries don’t automatically change those that already exist. I can then safely renumber the new rows manually.

Appearances matter too, at times I need to use different numbering styles, from the simple (1,2,3,…) to more complex formats such as (A.1, A.2, A.3,…) or (NF-01, NF-02,NF-03…) that involve different sections within a given table, and using different separators, with or without leading zeros.

Word does offer some basic tools for this kind of formatting. For example, it allows you to use outline numbered lists in the first column of a table. I have found these to be tricky to use, especially with prefixes, and it is hard to lock down the numbering at a certain point, so you can be sure that nothing changes.

To address these issues, I decided to write my own one-touch renumbering process.

Inserting and Deleting Improvements

One of my key requirements is the ability to quickly add new rows. I often need to record several new ideas in a table very quickly, for example, when recording workshop findings during rapid discussion.

Word lets you insert lines, but this can require several keystrokes, and you have to be careful how you do it. In Word, it matters whether you insert above or below the current line. I would often get it wrong, and end up with section or heading row formatting copied into the body of the table, and have to use even more keystrokes to correct this.

I decided I needed a one-touch insert function that reliably inserted (say) 5 blank lines below the current line and positioned the cursor ready for rapid entry.

Creating blank lines for quick entry means occasional empty, unused lines. I decided I needed a table clean-up routine to remove unwanted rows before the renumbering started.

Having a one-touch insert function suggested the need for a complementary one-touch delete, something that would delete rows if rows were selected, or regular text if that was selected instead.

Getting Started with the Build.

Microsoft Office comes with a development tool called VBA. You can get started with VBA by having Word record a series of keystrokes and then see how these actions have been converted into VBA code ready for repetitive use. There is a vast amount of information on the web about getting started with VBA, and most BAs will be productive in just an hour or two.

I decided that my table tools would be launched by shortcut keys rather than by using the Ribbon menu. Ribbon coding isn’t for the faint-hearted, and for speed reasons I wanted to keep my fingers on the keyboard as much as possible.

I needed a way of making the tools available to any document without having to load code into each. I found that Word allows you to load a template into its startup folder. This gets opened automatically and allows the code within it to be used by any document. In some environments, this code needs to be digitally signed, but there are simple tools available to self-sign the code for each PC you use.

My first major task was to prove the tools could be invoked correctly. I did this by creating some test routines, assigning them to shortcut keys and confirming I could use them whenever a I needed.

I then tested the basic table manipulation tools in VBA. These included stepping through each row, updating text, deleting rows and similar functions. Word has some quirky ways of marking the end of text in cells, so these tools took a bit of getting used to.

I also needed to store information about the tables. For example, which tables allow renumbering, whether a prefix being used, and what separator should applied. To do this, I decided to use custom document properties, and had to build a set of tools to read these values and update them when they were changed by the user.

The basic routines came together fairly quickly, but I did spend quite a while making the logic handle the wide variety of table manipulation tasks that a BA needs.

I also found that my use of tables really took off when I simplified the text styles I used for tables. I recommend taking the time to set up new styles for standard table text, table bullet points and table headers. Keeping these separate from the regular text styles allows easy change of the fonts to fit the changing cell space availability, and assigning these styles to shortcut keys means they can be used quickly and reliably.

Don’t forget to leave your comments below.