A Blog of a Different Color
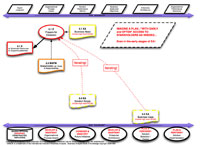
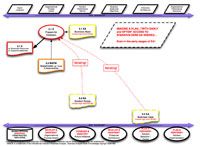
This month we start a series of collectible diagrams – The BOK task inputs and output rendered in a series, in color, with a few interpretations here and there. You want to keep these, as we will cover every BOK task before we are done.
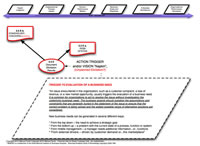
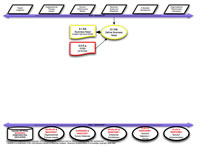
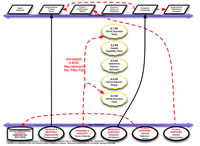
This month we present a “legend” to understand the diagrams, plus some interpretation leading to the “initiation of BOK activities”, and showing the generation of the “Business Need” that is required even before “Business Analysis Planning and Monitoring” can begin. And a bonus interpretation, at bottom!
Here we go!
Click on the images for an enhanced view!
Don’t forget to leave your comments below.
