
Business Case Clarified – Vision-Schmision Part 5
 Motivation:
“If you are going to be incomplete, at least nail your most important business process!
Ingredients:
Business Need
Any Enterprise Architecture not limited to:
Organization (Business) Goals & Objectives
Performance Metrics
Organizational Process Assets
All Solutions [Constructed, Deployed]
Ten Stakeholder Types (and all their ideas)
All Information Available on Risks
Business Analysis Resources As Needed
“Danger, Will Robinson!” If you are wearing a PM hat, your sense of “scoperiety” is about to be violated, but try to relax. This is business analysis, not project analysis.
Welcome to Part V of our series on Enterprise Analysis, AND the use of these tasks are not “sequential” as presented, but highly iterative. ALSO, I remind myself (my readers need no reminder) that we have a gentleperson’s agreement that we don’t have time to be “complete”. All we are doing is trying to improve on “Go Paperless for $10,000,000” (see the Schmision Part 1 for more details).
A good way to get a higher quality “scope” out of the initial vision is to play “what if” with a quality business case. This is because any significant project represents something new to the enterprise “consciousness”. The newness implies risk, uncertainty and many assumptions. Even the constraints are assumptions, especially if the constraints are not analyzed for their impact on potential outcomes. “What if” thinking is one route to making higher quality decisions given uncertainty. * This is especially important if formal feasibility studies will not be done before full project commitment. **
Enterprise Analysis (which includes Requirements Analysis work) led us to Define the Business “Knead”, Assess Capability (and other) Gaps, and Define Solution Approach(es) and Solution Scope(s). We pluralize the solutions on purpose. First of all, we wish to present as professional BAs, offering choices, pros and cons, not opinions, attitudes and personal preferences. Second of all (a major point of this series), the rush to solution” is a key failure mode of large projects. By examining alternatives (see Part IV last month), we begin to understand the true impacts of the solution choices, and the tradeoffs inherent in choosing a specific project scope and set of priorities.
This is great “pre-project” stuff – you know – requirements as its own “pre-project project”. This kind of practice could maybe improve the quality of the Project Management Office’s “triage”. It might also (my favorite) give the next analyst in line a head start on next analysis steps. There is ALWAYS a next analyst in line, because there are always next analysis steps – pay us now, pay us later). If no professional analyst is assigned, it means that the end users step into the role with a vengeance. Example analysis by end user experts: “This stinks, can’t use it.”
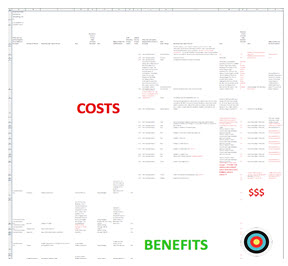
To minimize the need for such expert analysis, we imagine starting the project on the right foot by presenting a high quality business case instead of a weakly analyzed cost justification. In case you forgot, click here for a glance at the “cost justification” from Schmision Part 1.
Now, let’s compare the “just costs” analysis to a business case that resembles the actual business we are in. Notice the beginnings of (and one of the primary purposes of) traceability.
We start by “cleaning up” (analyzing) the Business’ goals and objectives. We do this by reconciling their relationships with each other and with the problems and the opportunities as understood so far (the “Knead” itself). In return we get guidance for how to organize the business case, better understanding across the high level requirements, PLUS feasible “summary” potential.
This analysis following (once again, with the gaps???) immediately suggests gaps. We do this analysis by figuring out that “Some of these things belong with the others”. We continue to add gaps that we (all stakeholders) see, and fill them where we know how.
Goals/Objectives/Issues/Opportunities and their relationships:
- Increase 2013 Undergraduate enrollment from 37,213 in Fall 2012 to 41,500 for Fall 2013. DO THIS BY:
- Increasing applications from around 49,000 to over 55,000 (how??? How many of the new applicants will be qualified? How many will then accept our offer to attend??? Can we )
- Reducing lost applications/applicants (see issues 1, 2 below).
- Reducing dropouts (and transfers???) from 3723 per semester to 1500 or fewer. This should result in Undergraduate enrollment levels of at least 38,500 at end of Spring 2014 (relate this to goals above???). DO THIS BY:
-
- Improving student satisfaction from 82% (2012 results) to 90% as measured by the 2013 annual “Student Satisfaction” survey to be given 12/1/2013 (see issues 1, 2, 4 below).
- Increase summer school enrollment 10% from 9833 in 2012 to 10,816+ by 2013 (how???).
- Attracting more undergraduate students to stay with us in anticipation of continuing their education within our expanding Graduate programs (see Goal B, below):
- Increase Fall Graduate enrollment from 12,360 in Fall 2012 to 13,500, to be split between academic departments. Goals are as follows:
-
-
- Law – 200+
- Business – 430+
- Media / Arts – 120+
- Public Safety (new department) – 320 plus
- PhD Programs – 70 plus
-
- Reduce costs even as business grows. DO THIS BY:
- Reducing employee turnover from 10% per year to 5% (???How???).
- Freezing hiring at 2012 levels (1017 employees) except for:
- Except for one new Dean for the new Public Safety department.
- While adding 20 contract faculty for new teaching workload (S
- While adding 20 contract faculty to offset expected contract attrition (we assume that contract employees and regular employees have the same impact on paper workloads).
- Improving employee productivity by XX%??? (see issues 1, 2, 6 below)
- By reducing time spent paper (information) handling
- ???With improved systems (integrated faculty scheduling, online student registration and class scheduling)???
- ???With other system initiatives??? (see issues 4 & 6 below)
- Cutting annual document archival costs by 90% for FY 2014 (see issue 5 below).
- Improve community relations, as indicated by the annual community feedback session plus a (new) formal survey of the community and trends in feelings and attitudes.: DO THIS BY:
- Expanding English as a second language outreach classes from 4 to 16.
- Improving student satisfaction??? – See above – students are community members too???). (see issues 1, 2, 4 below)
Known problems and opportunities related to the use of paper include, but are still not limited to:
Specific Issues:
- Bottlenecks / slowdowns in the student admission process due to sharing the paper application file (see Admit Student process in Appendix A). Our biggest competitor can give a prospective student an admission decision in less than two weeks, while our average is currently 5 weeks (???This average seems low given some of the delays given below – is this our average when everything goes well???). While we do not know how many students we lose because of delay, surveys show that over 30% of our applicants complain about the delays. Reasons given by applicants for not attending included:
- Missing financial aid, acceptance by other colleges, family or health issues, inability to provide a complete (Surveys were limited to applicants in our systems. We are not sure if we lose prospects that never applied on line, because they knew they were too late???).
- Lost or misplaced student transcripts delay financial aid. Estimated as around 250 per year never found, new transcript requested, and around 4000 that are stuck in inboxes, new transcript requested, original transcript later found (what happens???) student transcripts delay financial aid. There are other reasons that delay financial aid (missing information from students), which we believe is the cause of half of our 3723 student dropouts last semester. Financial aid delays can stretch for months instead of weeks, and always contribute to admissions decision delays.
- To hire faculty requires that anywhere from 10-20+ persons and 3+ academic departments (undergraduate, graduate and professional, and any “related” graduate programs???) examine the prospect’s academic transcripts. Confidentiality & privacy considerations discourage or forbid photocopying or e-mailing the transcripts. It can take from 2 to 12 weeks for the official paper transcript to pass from hand to hand, group to group.
- Grades are being computed and delivered by faculty on paper, for entry into a grade reporting system by each department (Dean’s Office). When questions arise about the grade, there is no detail to explain how the grade was awarded. Faculty explains that the criteria for grading are explained and written on the board at the beginning of each semester (every faculty does this???), student complaints to the ombudsman notwithstanding. The student must fill out a form to formally request explanation from the faculty member. The student ombudsman receives about 200 grade related complaints every semester. The number of formal forms submitted each year is less than 5. The reasons for the difference are unclear? There are approximately 37K students enrolled).
- Archival costs total $453,000 per year as of 2013. Almost half of these costs seem out of control due to repeated need to access already archived documents. These documents are often related to students who are taking longer than 4 years to finish their degrees. We need policies and electronic search to reduce this repeated manual paper archive searching.
General Issues:
- Departmental managers recently estimated from their own observations that employees spend anywhere from 10% (executives) to 50% of their time finding, moving and re-filing paper documents in support of their more expert administrative and academic work. These include, but are not limited to (are there estimates of quantities, time impacts per document?):
- Health care
- Counseling
- Housing
- Part-time work
- Recruiting, hiring, firing, benefits administration (and other HR functions)
- Regulatory compliance
- Legal work
- Grading
- Ombudsman cases
- Veteran’s educational benefits
- Fraternity & student organization oversight
- Faculty mentoring and counseling
- Preparation and follow-up for management meetings
- It is anticipated that more specifics are to be discovered if a decision is made to further analyze and detail requirements for a business case.
=================================
We will use the above reconciliation (highest level business viewpoint) to trace an electronic document based solution alternative (AS-IS vs. TO-BE) that we imagined in Schmision Part 4. When we are done, we will (imagine that we) have enough “dough” to imagine a business case, at last. This usually takes the form of a spreadsheet, not provided here . Let me know if you get the idea. I have mostly limited myself to the CRITICAL elapsed time for applicants in the analysis that follows, but could have added in more level of effort and personnel impacts as well.
Admit Student – “Potential Happy” Path(s):
| Step # | Step Description AS-IS | New Step TO-BE(s)? |
| 01 | Applicant (potential student) fills out an accurate and complete application package. | Applicant fills package on line, System verifies it is complete and accurate, so applicant can correct it before submitting – skip to step 13 (this choice seems out of scope for e-docs, yet maximizes impact on goals and objectives) |
| 02 | Applicant mails application package to Admissions | Applicant scans & emails package to Admissions – skip to step 9 (in scope for e-docs) |
| 03 | U.S. Post Office provides delivery service to Campus Mail Processing twice per day | Eliminated 1-7 days elapsed time in most cases. |
| 04 | Campus Mail Processing sorts application packages into Admissions delivery box | Eliminated 1-2 days elapsed time in most cases. Campus Mail Processing scans and emails package to Admissions – skip to step 9 (in scope for e-docs) |
| 05 | Admissions sends a Mail Pickup Person to Campus Mail Processing twice per day to:
|
Eliminated 1/4-day elapsed time on average. Elapsed time lost (10 mins to 1/2 day???) Level of effort (20 mins to 40 mins???) |
| 06 | Admissions time stamps all received mail. | Eliminated. Level of effort (1 hour to 10 hours each day???) |
| 07 | Admissions Clerk distributes mail to Application Evaluators. | Eliminated. Elapsed time lost (10 mins to 1/2 day???) Level of effort (1/4 day to 1/2 day???) |
| 08 | Application Evaluator time stamps all received application packages before working on any particular package. | Eliminated. Elapsed time lost (10 mins to 1/2 day???) Level of effort (10 mins to 3 hrs???) |
| 09 | Application Evaluator selects the application package with the oldest time stamp. | Time creating and maintaining an accurate paper queue is estimated at approximately 5-10% of Application Evaluator’s time. |
| 10 | Application Evaluator determines that the application package is complete. | Elapsed time lost (10 mins to 1 hr???) Level of effort (10 to 15 mins???) |
| 11 | Application Evaluator determines that the application package is accurate. | Elapsed time lost (1 hr to 10 hrs???) Level of effort (10 mins to 3 hrs???) |
| 12 | Application Evaluator passes the application package to Campus Mail Service inbox for twice daily delivery. | Time and effort guesstimated above. |
| 13 | Campus Mail Service copies application package for distribution to multiple departments:
|
Elimination of manual error and delays before delivery to academic departments may save from 4 to 24 days elapsed time. Electronic copies will ease sharing of data with agencies and may eliminate as much as 1 day to – 3 weeks elapsed time (Veteran’s takes 3 weeks to scan any unscanned financial aid apps). |
| Student Onboarding | ||
| WHEW! | I AM REALLY OUT OF TIME. | ESTIMATES BELOW OFFER BENEFITS FROM REDUCED ELAPSED TIME: |
| Lost prospects that were lost due to clumsy Administrative processes. | Estimated by Academics as 15-25%??? of the lost (not all) prospects. | |
| Prospects lost due to slow Academic processes. | Estimated by Administrators as 15-25%??? of the lost (not all) prospects. | |
| ETC. | 🙂 |
NEXT MONTH:
Something easier and more fun, we hope 🙂
==============================================================
*Bayes’ Theorem is another, and it allows us to measure our beliefs against emerging evidence. Unfortunately Bayes’ Theorem is much easier to apply to search and rescue missions than to complex business projects, which don’t even allow building robust business cases most of the time. The “retrospective” (lessons learned) in Agile is a mild attempt to apply “evidence” to beliefs. We set some priorities (prior beliefs), do some work (experiment and gather data), we learn what happens (“facts”, “evidence” and opinion), and then we update our beliefs (new priorities).
** The full project becomes the feasibility study, with the usual results. One way to make every project work better is to do small pilots (you knew that) before full speed ahead (ready, aim, fire, instead of fire, ready, aim). This makes the “feasibility” attribute of the full project more manageable and less likely to cost the moon.
*** Uh huh 🙂
Don’t forget to leave your comments below.
credit cards shop
… [Trackback]
[…] There you can find 94296 more Information to that Topic: batimes.com/articles/business-case-clarified-vision-schmision-part-5/ […]