Can You Picture It? Yes with a Swimlane Diagram!
There is the adage “a picture is worth a thousand words” and there is some truth to this. A picture is not just for capturing great moments like the company holiday party or a selfie with a friend. It also provides an effective way of showing a process to people.
We see process pictures in our daily lives. For instance, if anyone has ever brought home a piece of furniture from Ikea, you will recall they provide assembly instructions in the form of a picture, so you know how to put it together. With the recent pandemic, you have likely noticed the signage that businesses put up on their doors, walls and floors to provide instructions to clients on how to social distance, wash your hands, wear a mask and how to queue for service.


As Business Analysts, we have strong and well-developed communication skills – both oral and written. Our BA toolkits are filled with the many tools and techniques that we love and frequently use. When it comes to reviewing a business process with a diverse audience, having it in the form of a picture is one of the best ways to visually explain it. One of the techniques that does a fabulous job of this is the swimlane diagram.
I have been involved in many business transformation projects and the swimlane diagram is one of my most used techniques for capturing and analyzing business processes. They provide an illustrated process summary and are easily understood by both business users and technical teams.
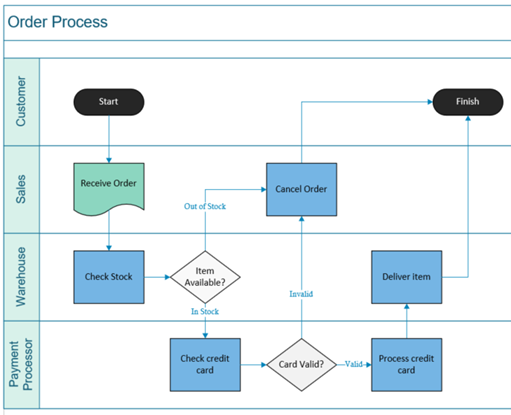
“A swimlane diagram is a type of flowchart that delineates who does what in a process. Much like the lanes of a swimming pool, a swimlane diagram provides clarity and accountability by placing process steps within the horizontal or vertical “swimlanes” of a particular employee, work group or department. It shows connections, communication and handoffs between these lanes and it can serve to highlight waste, redundancy and inefficiency in a process.”
“Swimlanes were first introduced back in the 1940s in what was called a multi-column workflow chart. Later in 1990, Geary Rummler and Alan Brache brought forward swimlanes diagrams in their published book Improving Performance.” Since then, the swimlane concept has become a widely used process modelling technique. Swimlanes can also be referred to as Rummler-Brache diagrams or cross-functional flowcharts.
The BABOK highlights the swimlane diagram as a business process modelling technique used in flowcharts, Business Process Modelling and Notation (BPMN) and Unified Modelling Language (UML) activity modeling methodologies. There are other modelling techniques that use the swimlane concept as well such as a Service Blueprint, Customer Journey map and LOVEM (Line of Visibility Enterprise modelling) methodology.
At one time, Microsoft Visio and iGrafx were the primary applications used to design these types of diagrams. However, today there are a variety of cloud-based service options that provide the same functionality either for no cost or for a subscription fee.
The great thing about a swimlane diagram is that it doesn’t need to be overly complicated. At a bare minimum, all you need to capture a simple process is:
- The actors involved (eg. Roles, groups, departments, people)
- The basic steps / activities (using an action)
- The decision points (typically in the form of a question)
Advertisement
Once you have that, map out the sequential steps as they happen through the appropriate swimlanes from the start to end. There you have it – a visual representation of a business process. You can elaborate on this simple diagram to add in further details / identifiers (ie. phases, dates, timelines, rules, systems, notes, etc) as well as follow specific process modelling methodology notation.

Some of the benefits to using a swimlane diagram to capture business processes are:
Summary on a Page
- Provides a visual picture that tells the story of a business process
- Highlights the various stakeholders / roles, decisions and the hand offs between them
- Allows for comparison of different states (eg. current vs future)
Easy to understand
- Describes the steps in a concise and sequential manner
- Provides clarity on the activities and who’s responsible
- Both business and technical teams are able to grasp it
Facilitates process improvement
- Highlights where delays / bottlenecks occur, areas of rework, mistakes or wasted time
- Identifies any missing stakeholders or steps
- Provides as a baseline for improvement
While the swimlane diagram has its advantages, there are a couple of pitfalls to be aware of. A swimlane diagram can become quite complex and hard to manage if it isn’t structured properly. Also, some business problems may not be apparent in a high-level diagram and swimlane diagrams can become quickly outdated or hard to maintain if it isn’t kept up to date.
Overall, the swimlane diagram is one of the best tools to provide a snapshot of a business process. This process picture provides a summary that facilitates an understanding for both business and technical teams of what roles/people, activities and handoffs are involved. Swimlane diagrams are readily used by Business Analysts and non-Business Analysts alike for this reason. If you are just starting out on your BA career journey, this is definitely a technique to add to your toolkit.