For the Love of Data: An Overview of Data Modeling for BAs
I have always been a data fanatic. It started when I was a programmer analyst and learned to love such arcane data structures as ISAM (a relic), VSAM (simple, but efficient), and later DB2 (powerful and flexible).
My recent database exposure has been MySQL for websites, but only as a BA.
Mind you, I love process work, too, but maybe I just prefer the structure of database fields, columns, rows, and tables. Or maybe it is being able to query and manipulate the data to provide information useful for doing business or making decisions. Whatever the reason, I have long had an appreciation for and a love of analyzing data needs and turning them into robust logical or business data models.
So, let us get started with this overview of logical data modeling, which is divided into three basic steps.
Step 1: Entities
The central element in a logical model is an entity. It represents the people, places, things, processes, and events in an organization. All operational data fits into specific entities and if done correctly, only one. Note that physical databases might introduce redundancy for performance reasons. Take for instance a simple banking example with four entities in italics. Your money sits in accounts, which have deposits and withdrawals, and periodic statements are sent to one or more of your addresses.
Entities by convention are named with a singular, business-oriented noun. For our example, the entities might well be called Account, Transaction (an abstraction of deposit or withdrawal), Statement, and Location (instead of address). Choosing an appropriate name is harder than it may seem. I have witnessed teams toil over the best name and level of abstraction. The effort is worth it, though, to provide long-lasting data structures with meaningful names to the organization. Physical databases implement entities as tables or files.
Step 2: Relationships
Once the entities in question are identified, it is time to tie appropriate ones together into what are called relationships. Relationships are used to eventually tell the database engine which data elements belong together and should be retrieved together. In a physical database, relationships are expressed using keys, which are covered below. Once the entities in question are identified, it is time to tie appropriate ones together into what are called relationships. Relationships are used to eventually tell the database engine which data elements belong together and should be retrieved together. In a physical database, relationships are expressed using keys, which are covered below.
For our banking example, an Account has a relationship to the Transactions which identify the accounts a deposit or withdrawal applies to. A Statement is a collection of Transactions, so a relationship is needed there. Finally, Statements are sent to Locations, whether a physical address or an electronic one. For our banking example, an Account has a relationship to the Transactions which identify the accounts a deposit or withdrawal applies to. A Statement is a collection of Transactions, so a relationship is needed there. Finally, Statements are sent to Locations, whether a physical address or an electronic one.
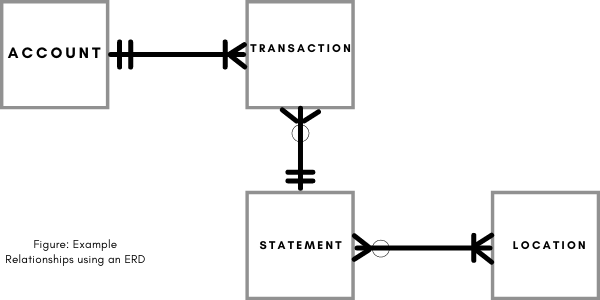
Here are the categories of relationships in a logical model, with examples from the banking application shown in Figure 1: Here are the categories of relationships in a logical model, with examples from the banking application shown in Figure 1:
⦁ One to one (rarer than you think; maybe the bank needs a credit report entity and for some reason limits them to only one credit report per account.)
⦁ One to Many (an account can have many transactions, but a transaction belongs to only one account.)
⦁ Many to Many (statements might be sent to multiple locations and a given location might receive multiple statements.)
Our small banking example might look like the image in Figure 1 when depicted using “crow’s foot” notation, a common data modeling diagramming style. (There are other styles, but “crow’s foot” has been around a long time and is commonly used.) The “crow’s feet” represent “many” and the bars show “one.” The “O” symbols on the model designate “optional” or zero associations. Our small banking example might look like the image in Figure 1 when depicted using “crow’s foot” notation, a common data modeling diagramming style. (There are other styles, but “crow’s foot” has been around a long time and is commonly used.) The “crow’s feet” represent “many” and the bars show “one.” The “O” symbols on the model designate “optional” or zero associations.

To interpret the diagram, we can say an Account has at least one Transaction but likely will have many. A transaction applies to a single account and is not optional. A transaction appears on a single statement, but a statement can have “zero, one, or many” transactions on it. A Statement is sent to one or more Locations, while a given Location may receive no Statements, but can receive many over time. The above diagram is commonly referred to as an “Entity-Relationship Diagram” or ERD for short.
Step 3 – Attributes
After relationships are identified in a model, specific data the business wants to capture and report on can be added to the entities. The data elements are called attributes and could be added as soon as entities are defined, but it is easier with relationships in place. In a physical database attributes become fields or columns of data. After relationships are identified in a model, specific data the business wants to capture and report on can be added to the entities. The data elements are called attributes and could be added as soon as entities are defined, but it is easier with relationships in place. In a physical database attributes become fields or columns of data.
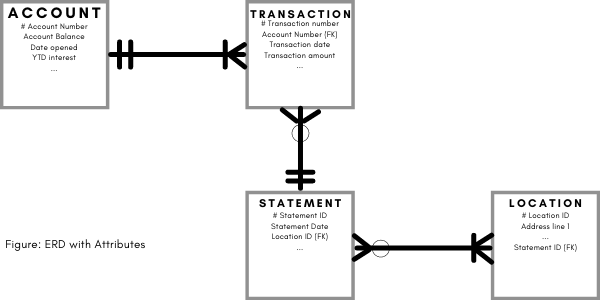
Like entities, attributes are labeled with a singular noun. For our banking example, a few facts pertaining to each entity are shown in Figure 2. Like entities, attributes are labeled with a singular noun. For our banking example, a few facts pertaining to each entity are shown in Figure 2.

Primary keys
The # in the example above represents an important concept in a data model called the “primary key” or “unique identifier.” Each entity needs an attribute or attribute combination with values unique to each occurrence of the entity. To distinguish one transaction from another the “# transaction number” attribute must have unique values for each separate transaction. An arbitrary identifier (sometimes called a “one-up” due to its sequential nature) is frequently used for this purpose. The # in the example above represents an important concept in a data model called the “primary key” or “unique identifier.” Each entity needs an attribute or attribute combination with values unique to each occurrence of the entity. To distinguish one transaction from another the “# transaction number” attribute must have unique values for each separate transaction. An arbitrary identifier (sometimes called a “one-up” due to its sequential nature) is frequently used for this purpose.
Foreign Keys
To solidify relationships between entities, “foreign keys” are used. A foreign key is a primary key of one entity added to the entity on the other side of the relationship. The Account-Transaction relationship is bonded using the account number key of Account placed in the Transaction entity represented with the “(FK)” in the example. Note: the exact way of showing attributes, primary keys, and foreign keys is usually determined by your organization’s modeling software and standards. To solidify relationships between entities, “foreign keys” are used. A foreign key is a primary key of one entity added to the entity on the other side of the relationship. The Account-Transaction relationship is bonded using the account number key of Account placed in the Transaction entity represented with the “(FK)” in the example. Note: the exact way of showing attributes, primary keys, and foreign keys is usually determined by your organization’s modeling software and standards.
Attributes are meant to represent single facts and if you discover an attribute that repeats or is in the wrong entity, then it needs to be adjusted using “normalization.” The Statement-Location relationship causes repeating attributes due to its Many-Many relationship. Normalization would solve this, and the topic could be an entire article on its own. Suffice it to say that “an attribute must be dependent on the key, the whole key, and nothing but the key.” The quote is attributed to a past database guru and summarizes how attributes should be added to entities. Attributes are meant to represent single facts and if you discover an attribute that repeats or is in the wrong entity, then it needs to be adjusted using “normalization.” The Statement-Location relationship causes repeating attributes due to its Many-Many relationship. Normalization would solve this, and the topic could be an entire article on its own. Suffice it to say that “an attribute must be dependent on the key, the whole key, and nothing but the key.” The quote is attributed to a past database guru and summarizes how attributes should be added to entities.
Summary
Data modeling is fascinating to me because it helps turn the ambiguity of possible data needs into a precise depiction of business rules and requirements. I have come to realize that constructing a robust data model helps us discover the meaning of the data to the organization. Focusing on the meaning of data has helped me to resolve intricate normalization issues that inevitably come up. Hopefully this article provides a quick introduction or refresher to help you get the most out of your data work. Data modeling is fascinating to me because it helps turn the ambiguity of possible data needs into a precise depiction of business rules and requirements. I have come to realize that constructing a robust data model helps us discover the meaning of the data to the organization. Focusing on the meaning of data has helped me to resolve intricate normalization issues that inevitably come up. Hopefully this article provides a quick introduction or refresher to help you get the most out of your data work.