
Using Scope Models to Manage Solution Scope
Organizations launch change initiatives (projects) for the purpose of delivering a benefit to the organization.
One thing that may cause those change initiatives not to deliver those expected benefits is scope creep. Scope creep is the unexpected and uncontrolled expansion of a project’s scope. This can occur when the scope of a project is not properly defined, documented, or controlled. Scope creep generally negatively impacts the project’s budget and/or schedule. Increasing project scope can also increase solution scope.
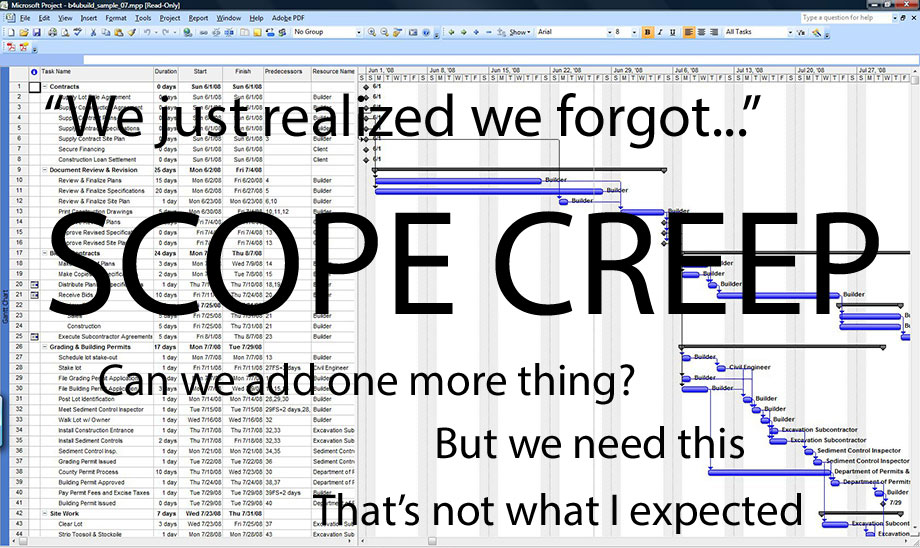
One way of defining and documenting solution scope is by the use of scope models. I do caution that this is not the only way of documenting solution scope, and multiple ways of defining and documenting scope should be used for every change initiative undertaken. Solution scope should be defined and documented in the way that allows the project stakeholders to understand the scope. Scope Models should create a shared vision of the solution scope amongst the stakeholders.
I am going to show you six scope models I use. There are definitely more models that can be used as scope models, but I find these to be the ones I use the most. Which models you use depends on the type of change initiative you are undertaking and what will describe the solution scope to the stakeholders the best.
Related Article: Using Feature Trees to Depict Scope
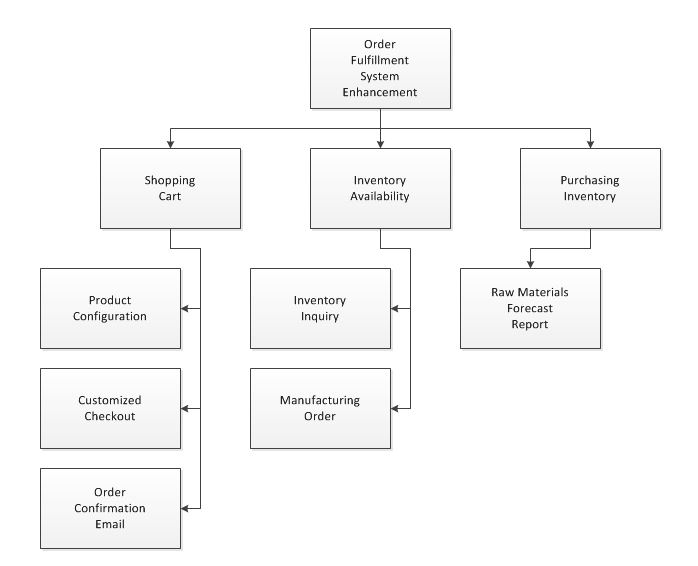
A Functional Decomposition depicts a subject and the breakdown of that subject into smaller buckets. This breakdown can be in multiple levels; meaning break down the subject into the highest level components, then break down those components into small components. This can be done to three or four levels. Functional Decomposition can be done on a feature basis or work basis. Using the feature basis, you would take a system and break it down to its highest level functions, as shown below. Using the work basis, you would take a work initiative and break it down to its highest level pieces of work; then break each of those pieces of work down to smaller chunks of work. This is useful to create a work breakdown structure and estimating work effort.
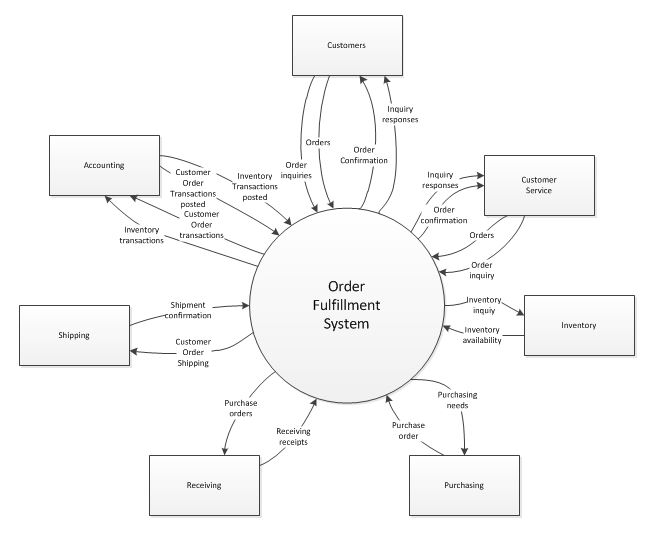
The Context Diagram depicts the system that is under discovery, the focus of your change initiative, and the external entities that interact with that system. These external entities can be systems, databases, websites, or business units (people). This model also identifies the data flowing between the external entities and the system under discovery, and depicts the direction of flow for each piece of data. One limitation of this model is that in only depicts external entities that directly interacts with the system under discovery.
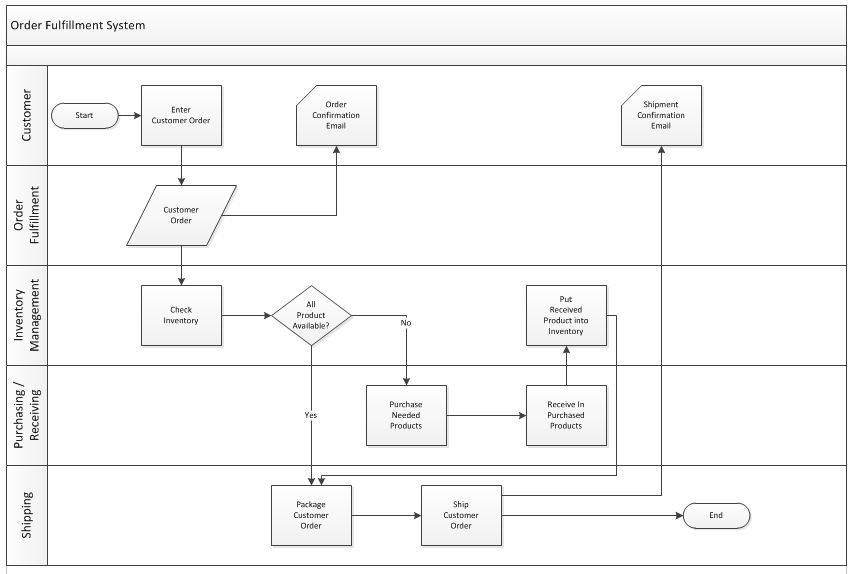
A Process Flow illustrates high-level processes and the entities involved in those processes. A common process flow diagram is called a swimlane diagram. The swimlane diagram shows processes in a row, or lane, entitled by the entity that performs those processes. Several lanes are depicted in a swimlane diagram so that you can see the interactions and dependencies within the process, as shown below.
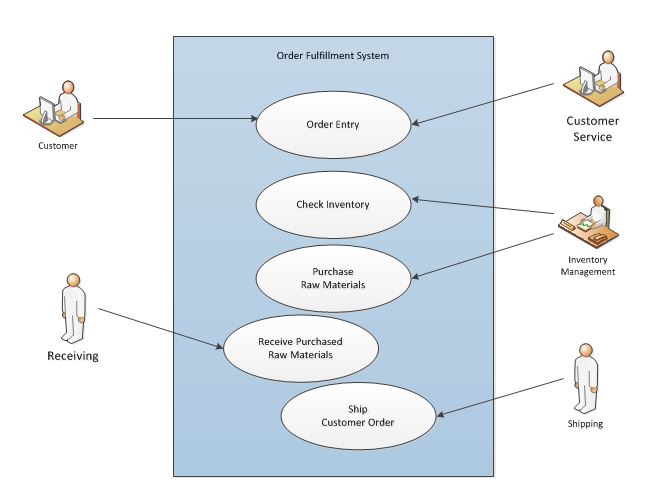
A Use Case Diagram is a representation of a user’s interaction with a system that shows the relationship between and the different use cases (functions) in which the user is involved. A use case diagram can identify the different types of users of a system and the different functions those users perform using the system.
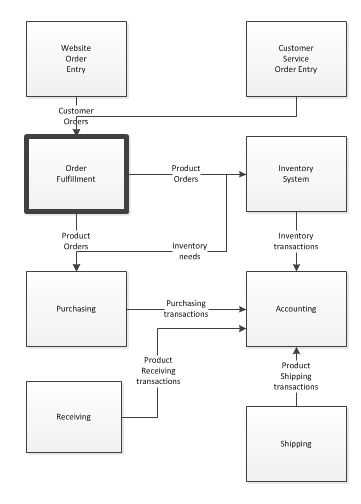
An Ecosystem Map shows the system under discovery and the systems which send data to or receives data from that system. The major difference between this model and a context diagram is that the ecosystem map will show systems that do not interact directly with the system under discovery; that is upstream and downstream systems. As shown below, a website order entry system sends the customer order to the order fulfillment system, which sends product data to inventory system and purchasing system. The inventory system sends the inventory transactions to the accounting system. The accounting system also receives purchasing transactions from the purchasing system. Even though the order fulfillment system doesn’t interact directly with the accounting system they are both exist in the ecosystem; and therefore, are shown on the ecosystem map. The system(s) under discovery will be shown with a bolder outline than the other systems in the ecosystem map.
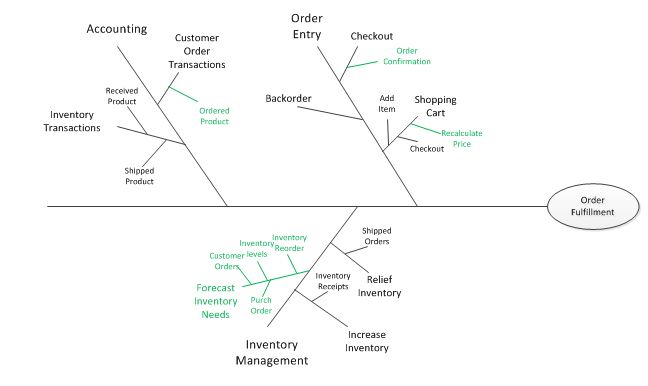
The Feature Tree is a fishbone diagram showing the features within the system. Much like the functional decomposition, the feature tree breaks higher level features into lower level features. Level 1 (L1) features are the highest level features and branch off the horizontal line of the diagram. Level 2 (L2) features are lower level features which branch off the L1 features. There is no reason to go beyond three levels of features. You can use color coding of the features to show what is in scope, out of scope or features in future releases. This is an excellent model to show executives, as it is a very easy picture that allows for a very quick understanding of the features being looked into.
It may be necessary to use multiple scope models to ensure that all stakeholders understand the solution scope of the change initiative. By using these scope models, as changes to scope are suggested you can determine if the change being requested is within the model. If it is not, you can caution the stakeholders that this may cause scope creep that will impact the project scheduled and/or budget.
สล็อต ฝากถอน true wallet เว็บตรง 888pg
… [Trackback]
[…] Read More Information here on that Topic: batimes.com/articles/using-scope-models-to-manage-solution-scope/ […]