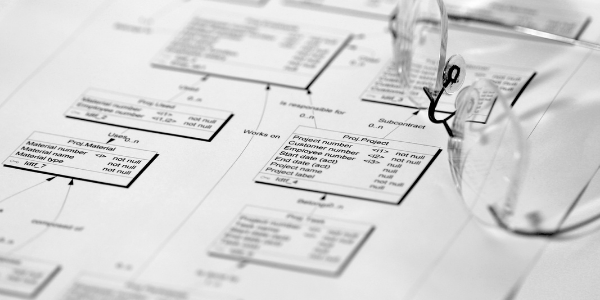
Talking to some younger BA colleagues recently, it came as something of a surprise that they didn’t know what an Entity Relationship Diagram was.
While people may associate them with data geeks and the detail of database design (where they’re certainly pretty useful) I’ve mainly used them in business contexts, where they’ve been equally useful in various ways.
What Is An Entity Relationship Diagram?
An ERD, or Entity Relationship Model as they’re also described, allows us to model an organisation’s data. That’s not just the physical data within the various applications and their databases, but high-level business data, even at enterprise level. That’s also known as ‘logical’ data.
To understand what that is, imagine going for a walk in a country location and using a paper map. The map shows you paths, landmarks and other information but it doesn’t tell you that a path is muddy or there are cows in the field you’re crossing. The map is simply a representation of the terrain you’re walking across. Likewise, an ERD is a pictorial representation of an organisation’s data, which can be used as a map to guide people through that organisation.
A data entity is simply something that describes data attributes that are connected in some way. Thinking about you as an individual, your data entity could include:
- Name
- Date of birth
- Social security number (NI number in the UK)
- Contact details
There could be linked entities for your family – parents, partners, siblings and children. There would be entities describing the jobs you’ve held, educational establishments you attended and addresses you lived at.
ERD as a Business Tool
The entities above would typically be part of a job application or HR system so, if you were designing such a system, an ERD would be a good place to start doing this. And you can show that picture to the various stakeholders who’ll be using the system, be they in the HR team, hiring managers or even managers with no hiring responsibilities.
I worked for an Insurance company that was undergoing a major transformation and we used ERD’s for each business area, validating them with all senior managers in the company, not just those within the business area. That gave us a 360-degree view of potential data requirements, which often threw up insights from those outside the immediate business area who might use that data.
An example of that would be Claims staff wanting to see Underwriting data, so they could assess whether a particular risk was covered together with any conditions associated with the cover. Being able to identify that data easily was really important to them. Admin managers might need to understand resource requirements using various criteria, that an Underwriting manager might not be the slightest bit interested in. ERD’s were a great way to underpin those discussions and we got many useful insights that we might not have got otherwise.
Of course, you can (and should) use an ERD to also drive the design of a database or data warehouse, and that applies even at a business level (rather than a detailed technical level). An example of that involved an Investment Management company who wanted to build a Data Warehouse to better analyse client data. The problem was, they couldn’t really pin down their requirements accurately enough for the 3rd-party supplier who would be building it. I got involved and sat down with the key user to build a high-level ERD covering the scope of the specific business area.
That forced them to think about what data they wanted and how it all fitted their key business reporting requirements. We then expanded the model to include the business attributes of the data, splitting those out into measures (items we wished to quantify) and dimensions (the lines along which we wished to analyse them). So a measure might be commission charged and a dimension might be client or security type. We then tracked those business data items into the application database to build the agreed data items and reports.
ERD’s and Data Definitions
This drove other discussions such as “What do you mean by commission?” The investment manager would charge their clients a commission depending on the size of the fund managed. This was often shared with other professional advisers connected to that client. So, did “Commission” mean gross commission received, the net after sharing?
The ERD proved to be the common interface between the client’s business-facing and technical staff, who normally spoke completely different languages. That enabled us to extract the correct data and report it accurately. It gave us a traceability matrix, from high-level entities down to physical database fields, and the project was a huge success.
But it doesn’t just apply to data warehouse design. All organisations will require some level of management reporting and it’s crucial to understand what users want and how you can deliver that. Another project involved a CEO complaining he got inconsistent figures for a key measure, depending on which business area he asked. By producing a high-level ERD, and defining data pictorially, I was able to highlight the various different and inconsistent interpretations of the key measures. This meant that they could ensure definitions were consistent across the organisation, or that necessary differences were clearly documented and understood.
Summary
You don’t need to go to the level of defining things like optionality, foreign keys or Third Normal Form in an ERD. It can be as simple as named entities (without their data attributes) and the basic relationships between them. That alone can be a powerful visual tool for understanding an organisation. ERD’s should be used to define your data architecture, setting data standards and highlighting issues around data duplication and quality.
If you want to take your ERD further, maybe for application/database design, that high-level view is a great place to start. You don’t have to be a data scientist to produce an ERD; any competent BA should be able to do it.
Where ERD’s become incredibly powerful is when they’re combined with processes. But that’s a separate article entirely.
About me
A Business Analyst with 35 years’ experience, across various sectors but mainly in Financial Services. I’ve worked on a number of strategic transformation programmes and have particular experience in data-driven projects involving Business Intelligence/MI/Data Warehouse design. Currently working as a UK Central Government employee on a major Payments transformation programme.


