
Author: Line Karkov

Good at Drawing or Good at Visualizing – There is a Difference!

I often use simple diagrams and icons enhanced with text done with pen on paper instead of long presentations. It is a skill that I have practiced over some years now. Sometimes, colleagues tell me that I am good at drawing, but the fact is that I am not good at drawing. I am good at visualizing, and I am also fairly good at listening. This article is about what I mean by that.

Let me demonstrate with an example. The two drawings below are similar to two illustrations I did earlier this year. They are translated into English and made generic in content to make them understandable without knowledge of our business. I have also left out the detailed text that is included on the originals. Not only do they make no sense out context, but it also emphasizes the simplicity of the actual drawing.


Advertisement


Earlier this year, my manager asked me to do a drawing of our IT strategy. We work in an organization that is in the non-profit sector and we are not an IT organization. Out of 200 employees, 10 of us work with IT – all development is outsourced. The audience of this strategy was a management team where only my manager has a background as an IT professional. So, we needed to make it visual and easy to relate to. Part of our strategy is to rely as much as possible on software-as-a-service, so that we always have evergreen applications, and we don’t need to take care of upgrades etc. ourselves. “Evergreen” is a great image that is easy to understand and also easy to draw. I decided to include that in the visualization. When we talk about enterprise architecture and strategy, it is common to perform gap analysis and plan for closing that gap. A gap is also easy to draw. So, my first draft looked like the drawing below, with some text added on each side to about the goals of the initiatives and the applications that were impacted.


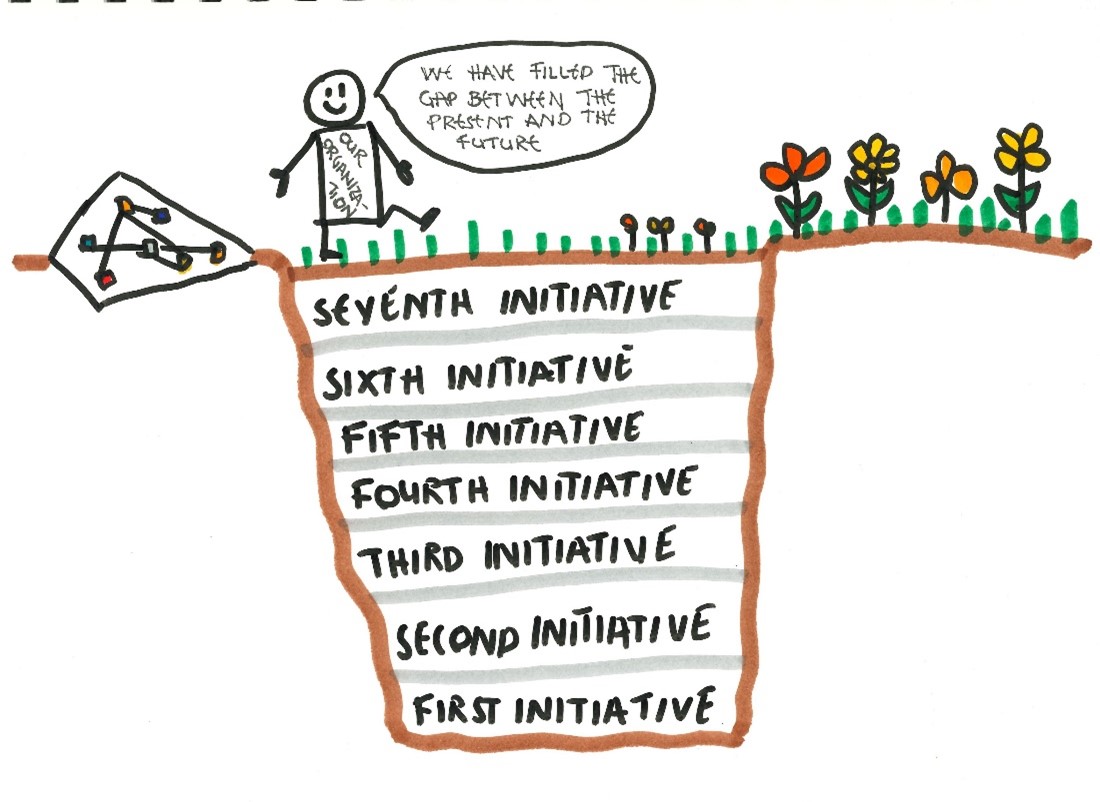
My manager presented this to our CEO, who said: “It’s a pit that we are filling with dirt?”. Having primarily worked in IT organizations, I have never questioned this metaphor of the gap. But he was right. When you think about it, it isn’t really that inspiring to just fill a gap. Ok, we needed something else. I have earlier used a Greek temple to illustrate IT architecture strategy. I like the comparison of solid, sustainable IT architecture with classic architecture with its timeless qualities. My first thought was an aqueduct transporting water to our evergreen application landscape. But I liked the idea of something that could transport our organization and was afraid that the aqueduct was too abstract. So, I decided to illustrate it with a bridge inspired by Roman architecture. The pillars of the bridge are made out of the initiatives on our roadmap. One pillar is made up of the initiatives for improving our services, and the other the initiatives for improving administration. Together, they will enable the organization to walk across from a withered to an evergreen field. That resulted in this drawing (again, with additional text next to the side of the pillars related to the goals):

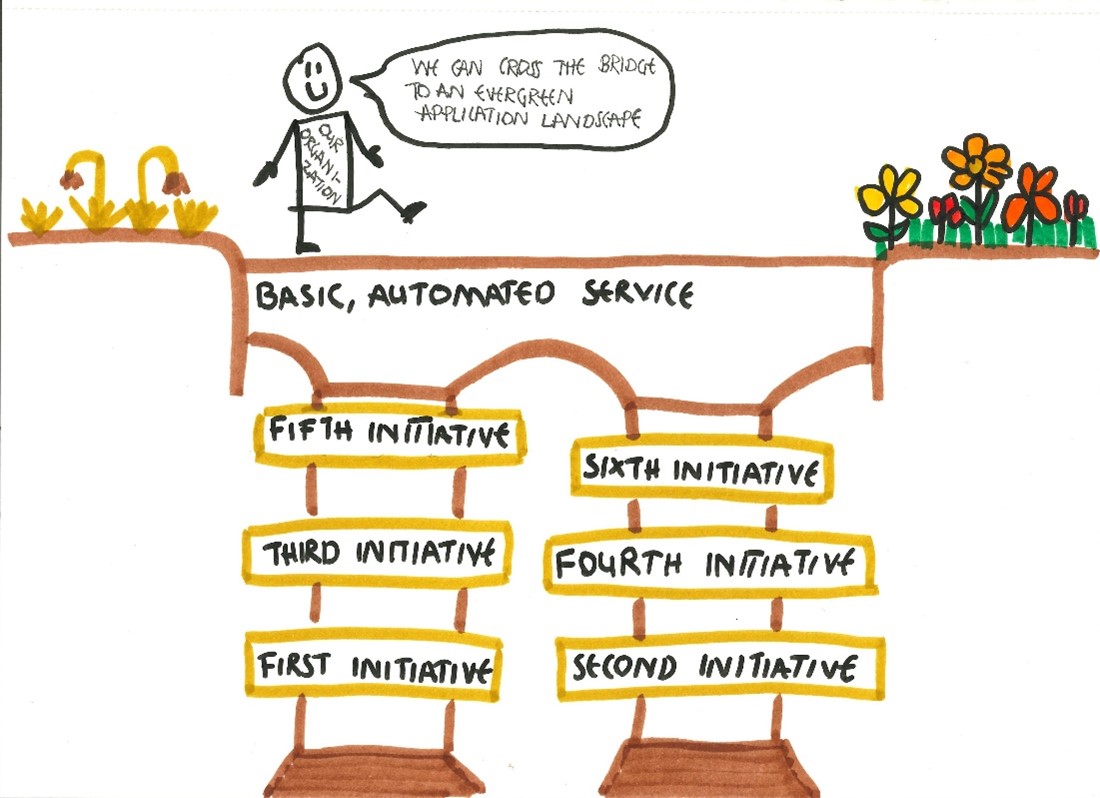
This was the drawing that was presented to the management and later to the board. I think it is a better drawing than the first one and that is not because it technically is a better drawing than the first one. But because the metaphor was more fit for purpose. This is what I mean, when I say that my strength is not drawing, but visualizing. The ideas for how to visualize various topics comes from listening to how people talk about their work, the topic for the visualization, and the feedback that I get. You might notice that the first drawing includes seven initiatives, the second only six. This is an example of how the structure can sometimes dictate content. We had to prioritize and leave an initiative out that is more related to infrastructure but was included for its significant impact on business users.

Below is a drawing that my son Thorbjørn did recently. He is 10 years old.

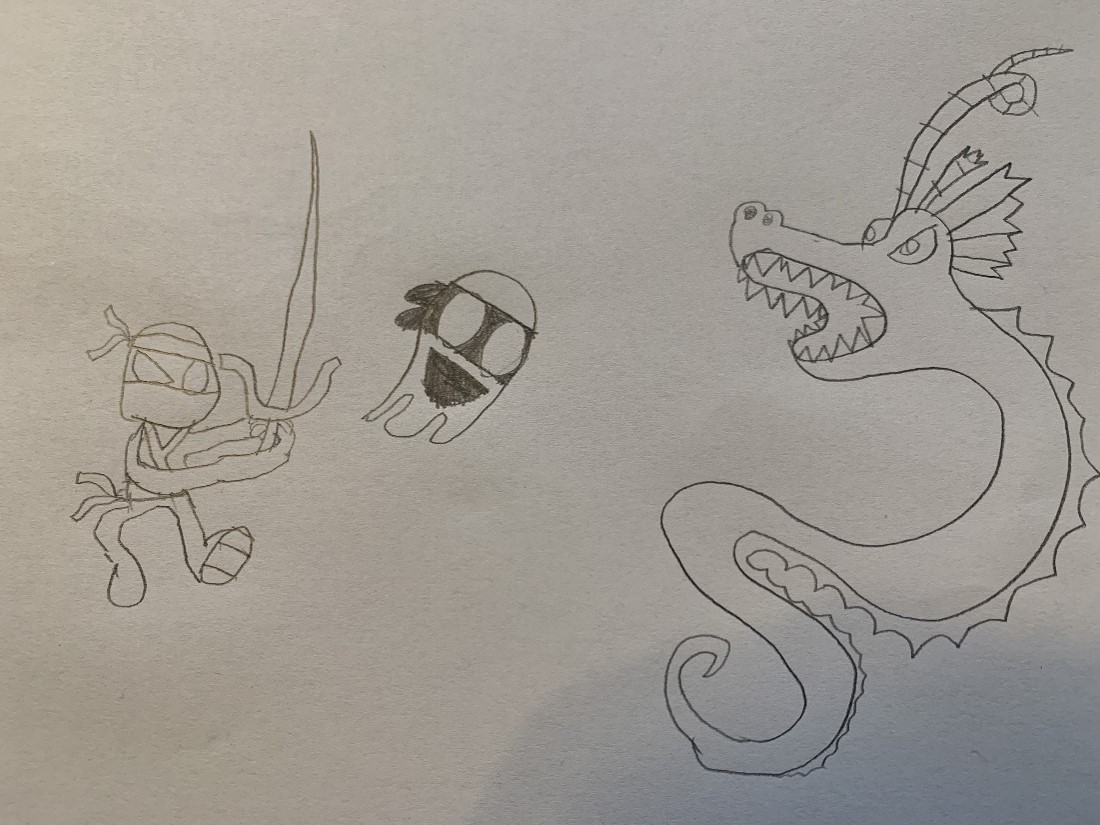
I think we can all agree that he technically is better at drawing, than I am. Look at the facial expressions and walking legs as examples.  So, just to emphasize the point even further: You do not need to draw as well as a 10-year-old to apply your drawing skills at work. You probably do to be a professional graphical facilitator, but that’s a completely different story.

As business analysts, many of us are well trained at visualizing. We use this skill when we do process maps, application landscapes, mockups, conceptual models or logical data models. Use this to your advantage, and you will find, that it is possible to learn the drawing skills that enable you to apply visual thinking in your business analysis practice.


Curious about visual thinking, but don’t know where to start? I wrote these articles last year, which might give you some inspiration:
Start your visual facilitation journey with letters. – Business Analyst Articles, Webinars, Templates, Jobs (batimes.com)
The icon library: My favorite analogue tool – Business Analyst Articles, Webinars, Templates, Jobs (batimes.com)

Turn your specifications into living, digital documentation

Digital transformation requires the use of new tools and new ways of working – also for business analysts. We often facilitate this for other groups of people, and we should be ready to look at our own habits and preconceived notions as well and embrace new mindsets and tools. This article offers a take on what ways of working could look like for the digital business analyst.

Collaboration is becoming increasingly digital, and this also gives business analysts many opportunities to work smarter and better. That is, if you are ready to let go of documents and spreadsheet, and instead embrace digital tools for wikis, notes and backlog management. With a wiki tool, you can easily build your requirements documentation using webpages in a tree structure. Your first pages describe your scope. Each of those pages can then be broken into details on several pages that branch out. If you are familiar with mind maps, you will see that this is basically the same structure. In fact, a mind map can be a great first sketch of how to structure the content of the wiki.

Advertisement

The wiki structure allows your documentation to grow dynamically without you losing the overview. This structure is very well suited for agile development. If you focus on establishing the scope first, you will soon have some documentation that is accurate, though it is high level. You can describe the scope of your initiative first, and sign that off with your stakeholders. Based on that, you can discuss deliverables with your developers, and establish your backlog with features or epics. The features or epics can then be prioritized with your stakeholders. You can then detail out the requirements on your wiki, and the team can break down the user stories based on the wiki. This means, that while your scope is fixed and signed off, your detailed requirements get fixed and signed off incrementally in the same pace as the team is developing. I have experienced this to be a good way to be able to handle scope creep (because I have the scope to keep the requirements in check) and to avoid analysis paralysis and requirements rot. Because it is digital, I can create links from my backlog items to the relevant parts of the specification.

The basic concept can be illustrated like this:

Why not just add my requirements to the backlog items, and avoid all the linking? Well, because I want my documentation to describe my product holistically, including its context. And I want my backlog to describe the increments that the product is built in. So I need both.  I can then communicate, what my product is and does without also having to communicate the increments it was built in, which is completely irrelevant to most of my stakeholders. I can easily share a wikipage with a link or present it in a meeting. This means fewer powerpoints to produce.

Once the product is built, I no longer need the backlog – my documentation is what describes the product. And with that documentation established at the very early stages of the product development phase, I can communicate what the product looks like through its whole life cycle, from the birth of the idea to the decommissioning of the product. Each page is automatically version controlled, which makes the change control much more granular, and changes easy to manage without keeping extensive change logs. In some digital tools, you can even set up approval workflows to make sure that the right people sign off on changes. I like to think of it as the DevOps mindset implemented in requirements analysis.

You can add any kind of content. A webpage has no limits when it comes to content – pictures, text, tables, links, and attachments. Your documentation can contain much more than a traditional requirements specification, such as personas, test data, samples of production data and other types of examples. Because of the tree structure, I always know which objective or process a detailed requirement supports. Obviously, various kinds of diagrams play an important role. Traditionally, you would argue that you must do your modelling using a modelling or BPMN tool. The reason for this is that your models can then be reused by others. In theory, this is true. However, I have never experienced this reuse in my 15 years as a business analyst.

Over the past couple of years, I have practiced using pen and paper for visualizations, and I have integrated this into my ways of working. It is a great way to work because it helps me focus and process information. It is also free of the constraints a computer program sets when you create digital visualizations. To my own surprise, this approach is very compatible with digital documentation. Simply take a photo or scan a drawing and add the image to the page. It can then be enriched with text for elaboration. This is particularly useful when describing scope, features or epics and application landscape. Digital and analogue are not contradictory, but complementary.

I have recently published two articles on BA Times related to using pen and paper, which provide some tips for getting started:

Start your visual facilitation journey with letters

The icon library: My favorite analogue tool

The icon library: My favorite analogue tool

With the growing use of agile practices and design thinking, there is also a growing awareness of the importance of working visually. If you are an inexperienced drawer, this is can be a major barrier for starting with sketch noting, visual facilitation and graphic recording. In this article, I recommend establishing an icon library to document your learning and growth as a visual practitioner.

An icon library is my repository of the icons and symbols that I have used. I have it so that I can reuse icons by simply looking them up. And yes, it is in an analogue format. In fact, it is a notebook with each page divided into six squares and room for a name for the icon.

The icon library is my box of LEGO bricks. They are the building blocks, that I use when creating visual content. To work efficiently, it helps to actually think if it as a box of LEGO bricks. Meaning, when drawing I have what is available in my icon library. I can use color, size, and the relation to other elements in the visualization to convey meaning. I can also combine icons and thereby create new ones. In that respect, I can use it as a constraint that forces me to think more creatively. While building with LEGOs you usually do not have the option to just go out and get new bricks. You use what is available.

The senior LEGO designer Søren Dyrhøj advices to copy other people´s LEGO models with the bricks you have available. Because when you copy, you are practicing the skills you need to create something original. The same goes for visualizations. When you get started, do not worry about coming up with something unique. Look around you and use what you see; imagery used by your company and established modeling techniques, and do not be ashamed to look icons up online.

Advertisement

When I am not under pressure to deliver, I do take the time to come up with new icons and symbols while creating visualizations. I try to always have the discipline to add them to my icon library then. When I start working with new subject matters or domains, I always make sure to invest some time in coming up with icons and metaphors that I can use for visual content. Also, when I start engaging with a new group of end users, I create an icon for that user. Usually, 70-100% of the drawings I use, are from my icon library. The LEGO metaphor is also one that I have used several times before in different contexts. It is suitable for topics concerning IT architecture consisting of “building blocks”, and for illustrating collaboratively creating a product. Another reason why I like it is because it also refers to my cultural heritage as a Dane (LEGO is a Danish design icon that we are very proud of).

Sooner or later, it is highly recommended to learn from a professional visual practitioner. There are many options for training available, and several books on the topic. This will familiarize you with a visual alphabet, which will take your skills to the next level and enable you to create original content. I personally recommend the book “UZMO – Thinking with your pen” by Martin Haussmann, who is one of the pioneers in graphic facilitation. His bikablo concept is very useful and easy to learn.

Working visually in analogue formats can be a truly liberating experience because you are completely free of the constraints built into digital tools. It can also improve the way you process and present information when you get rid of the abstraction level of the keyboard, and thereby have a closer connection with your content. With the right approach established – e.g. having an icon library – you can work just as efficiently as when using digital tools.

How to Make the Most of Project Process Descriptions

Management’s policies on definitions and documentation of project processes is the kind of thing that could convince you that Dilbert’s author (or Dilbert!) may be employed somewhere in your office. However, if you approach it in the right way, project process descriptions will no longer be a tiresome administrative task but can be used to your advantage. First of all, they can be used to clarify expectations in the project team and with other people involved in the project. Second, you will have valuable input for defining and estimating project tasks.

The purpose of this article is to discuss what the business analyst can achieve by taking active part in defining and describing project processes for requirements development and management.

CMMI: A Process Focused Project Model

Capability Maturity Model Integration (CMMI) consists of a number of process areas. Some of the areas are defined on an organization level and set the framework for the individual projects, for example Organizational Process Focus. Others are defined within the projects and the content will depend on the characteristics of the project. Two of the relevant process areas for the business analyst are Requirements Development and Requirements Management. The better the process areas are mastered by an organization, the more mature it is. A mature organization is able to deliver what the customer needs at the time and price estimated. The CMMI model gives you guidance – described as practices – on what to remember and to consider when defining processes within the process areas. What you do when defining a project specific process is describe how you implement the practices from CMMI. This means that you can use any method you prefer, as long as it is compliant with the practices. For example, in Requirements Development one of the practices is “Elicit needs” but this can be done using both an agile or a waterfall approach.

CMMI basically applies common sense in a structured manner. The main point is this: define and plan your process in advance, work according to that process, adjust it along the way, and learn from your experiences the next time around.

What to Include

First you describe the purpose of this particular process. You will do yourself a favour by focusing on the characteristics of the project instead of describing the overall purpose of developing requirements. This will help when you need to determine which methods to use. Your process description should contain the following:

Roles and Responsibilities
Who is involved and how are they expected to contribute? Who has the final word when it comes to prioritizing, accepting and approving requirements? This is important for the obvious reason that stakeholders and end-users will know what is expected of them. But there is another important point. Because you have identified up front who is supposed to participate, you will have everyone involved on equal terms from the beginning. A consequence of not doing this is that you could find yourself favoring groups of end users or stakeholders that are the loudest, are closest geographically to the development team or are in best standing with top management. This can be avoided by identifying your participants at the start and you will develop a “democratic” process for developing and handling your requirements.

Activities or Tasks to Be Carried Out
This is basically just outlining what to do in which order. For example, which method(s) do you intend to use when eliciting needs and requirements? How will you document or model your requirements? When are you done developing requirements? It is a good idea to also define entry and exit criteria for each activity. That is, what is needed in order to perform the activity and when do you know that you are done? This will not only ensure that you achieve what you set out to do but also that you do not overdo it or get lost in details.

How to Approach the Process

The extent of this work will depend on many things. For instance, how experienced you are and how well you know the other people involved. If you have done this many times before, it will just be a formality ensuring that your activities are in line with this particular project and setting expectations straight with the project team, stakeholders and end users. This will probably be something you can sketch out on a napkin during lunch. If you are new to the field, you need to consider how to incorporate best practice or theory from the field.

Create a First Draft

If you are new to the organization or the business area this is a good opportunity to ask around about previous experiences with the same kind of projects, find out what you need to pay special attention to, the relation between the stakeholders etc. This is, in other words, the perfect chance to “stick your finger in the ground”.

Review and Acceptance from Project Team
Before you communicate how you intend to approach the requirements development, it is important to have commitment from the rest of the development team. Also, if you don’t know the team members, this is a way to clarify roles within the project team. When reviewing project processes, be aware of overlap between different process areas. This can lead not only to duplication of work but also to unclear responsibility between project participants. For example, when working with requirements management, you have to be aware of the change management process and make sure that the two process areas are coherent. How to suggest a new requirement to the project will be described in change management, while how to archive rejected requirements would be included in requirements management.

Acceptance from Stakeholders and End Users
It is important that whoever is paying for the party agrees to who should be involved and the extent of their influence. This is probably the closest you get to a guarantee of commitment to the final result of the requirements development. When this is clarified with the project’s sponsor, you can communicate to your stakeholders and end users how you intend to involve them. Acceptance from everyone involved in the requirements development regarding the premises for the task, their role, and when they are expected to contribute is important for full cooperation. When this is settled in advance, you can focus on the actual objectives of the project in the requirements development activities. A good idea is to create a “start kit” for the people you cooperate with on this. It does not have to be more than a brief presentation about the project, their role in it and a list of the planned activities that they have a stake in. You can use this to elicit cooperation by presenting it at a meeting or simply sending it out for information.

Why Even Bother?

The issues described in this article will most likely be issues that all business analysts consider to a smaller or greater extent, more or less explicitly. So what is the point of documenting the processes you work by? First of all, in evaluating your processes you will define learning points and experiences. This makes it easier to improve the quality of your work both in the course of the project and in your next task. Second, it ensures that the methods you choose are tailored to the specific project. No two projects are the same which means that no two approaches to requirements development should be the same. Also, with growing globalization, projects will to a greater extent involve people from various cultures communicating in English, which is not necessarily their native language. This is at least true in my corner of the world, and this increases the need for talking about how we work and why. And how we work and why we work like that is basically what project descriptions is all about.

References: Mary Beth Chrissis, Mike Konrad and Sandy Shrum: CMMI, second edition, Addison-Wesley, 2007
The Texan CMMI guru Tim Kasse has written several books on how to apply CMMI based on his experiences in teaching and assessing CMMI in companies all over the world.


Line Karkov is Master of Science in Information Technology from Aarhus University, Denmark. Since 2007 she has been employed as a business analyst in Danske Bank Group’s internal development department. She works primarily as an internal consultant on large development projects. She teaches internally in development processes. The Danske Bank Group is the largest financial enterprise in Denmark and one of the largest in the Nordic region.