
Author: Marcos Ferrer

Free Use Case for Obama Care

Shortest blog ever – read it and weep, weep for the unpaid blogger. Free to the U.S. government, $1M one time fee to any commercial provider ($1M per “corporate entity”).

Assumption: Persons equate health care (which they want) with health insurance (which nobody likes, not even the folks who work at health insurance companies).

Precondition: Life

Actors: Persons and State Oligopolies (state authorized Insurance Company(ies))

Success Scenario:

  1. Person wants health insurance (clearly false, but see assumption above)
  2. Person accesses ObamaCare Website (OCW)
  3. OCW is available
  4. Person requests health care
  5. OCW checks with the Republicans
  6. Republicans respond with insurance instead of health care
  7. Person sighs and chooses insurance instead of health care
  8. OCW asks for Person to choose income and family circumstances (size, challenges)
  9. Person chooses an income and a set of family circumstances (size, challenges)
  10. OCW presents insurance coverage levels (Bronze, Silver, Gold) with prices for family
  11. Person selects to commit / buy a specific coverage level, hoping for health care in spite of the “gambling paradigm” of the insurance model
  12. OCW accepts the commitment from the Person
  13. OCW lets the person know the informational requirements for their family circumstances
  14. OCW lets the person know where they can get help understanding the informational requirements
  15. OCW provides a “to do list/wizard” with on-line assistance in how to complete same
  16. Person completes the to do list over a period of time
  17. OCW approves application and the casinos (state oligopolies) offer deals
  18. Person accepts a specific deal
  19. Casino (oligopoly) starts the game
  20. Person discovers the difference between insurance and health care

Alternate / Exception Path:

3a. IF OCW is NOT available, OCW SAYS SO, saving Persons unnecessary frustration

THOUGHTS oh fearless readers?

Don’t forget to leave your comments below.

Watch Out For Think-Holes

ferrer Oct1Answer to last month’s question: Change the “head of the fish” to balance benefit as well as cost. Example: “Why does internal service impact profitability?

Most of us have a pretty high opinion of our own thinking*. We are biased, but don’t see it that way. This makes complete sense. WE are ALIVE**. We are the latest survivors of billions of years of disaster, uncertainty, death and taxes***. We are the WINNERS! We must be doing something right. Right?

Right! As survivors, we have tremendous adaptations. Adaptations that got our ancestors away from lions and tigers and bears oh my!**** These adaptations are less useful than they used to be – see if you agree.

Fast thinking vs. slow thinking:

We have almost instantaneous abilities to recognize friends, spot strangers, see (and dodge) dangers, identify objects and their uses, feel body language, judge tone of voice and much, much more. The Nobel Prize winning economist Daniel Kahneman describes these abilities as System 1 thinking. 

Here is an example of System 1 thinking:

What is this picture?

ferrer Oct01

Here is an example of System 2 thinking:

If the average expenditure by a middle class consumer ($50K-$115K/year) at a SaveMoreBySpendingMore™ store is $18.25, and middle class consumers represent 94% of SMBSM customers in 2012, and our total customer visits per year in 2012 were 78,543,228, how much revenue came from middle class customers? *****

If the above seems excessive as an example, try this example of “slow” thinking (for most of us):

How much is (40 x 52) – 80?

Even though we “know” we can calculate the above fairly quickly, and we have a sense that the answer is not 17, or 15,000,000, we (I mean I, as my brilliant readers are not so limited) cannot calculate it as quickly as we can recognize a $100 bill.

The “thinkhole” here is the temptation to go with “first intuition” when it is not always the best approach. This can be appropriate (“Duck – here comes a rock!”), it can also be less (way less) than useful (“Let’s build a really cool space airplane just like the astronauts/pilots always wanted. That will be cheap, reliable and fun, just like flying jets.”). One way to characterize a BA is as a person who is willing to do the complex thinking for a larger group.

Anytime a complex decision is offered to a meeting, there is a real danger of the decision being made “quickly”, and almost surely “wrongly”. In such situations we must be ready with clear options and open facilitation to keep discussion (and follow up analysis) alive.

Some of you may recall the training video “Going to Abilene”, where a bunch of IBM trainees decide to go to Abilene after one of them tosses it out as an idea. They have a miserable, hot, dusty day and only get 1 hour in Abilene for their trouble. When they get back to training camp, they argue and place blame until they realize what happened. They went to Abilene because no one wanted to “contradict” their colleague or “put down” the idea. The colleague who suggested Abilene was quite clear. “Don’t blame me! It was just a thought. I didn’t think it was the greatest thought in the world, but when everyone went along I didn’t want to stand out!”

Solution: Do the slow thinking. Don’t force decisions. Simplify for the audience. 

Let’s look at some other thinkholes:

Aversion to Loss will prevent Desirable Strategies for Gain

Would you rather have a 100% chance at $1000, or a 90% chance at $1200 with a 10% chance of losing $50? Why? What if you get to play 10 times in a row? It is difficult to overcome fear of loss. The loss can be intangible – reputation, comfort, preference, etc. These fears can actually prevent our work as change agents. 

Solution: Do the “math” so all can see the tradeoffs, then duck . 

Preferring Apple Pie to Cherry, Cherry to Peach, Peach to Apple

Most individual pie eaters (not all) are consistent (their preferences are transitive, and Apple will beat Key Lime via Cherry), but most groups are not. Politics can illuminate this. In 2000, many democrats preferred Ralph Nader to John Kerry, and John Kerry to George Bush. By voting for Ralph Nader (their first choice), they got George Bush (their last choice). 

Those on the left that preferred Nader were NOT happy with Bush, and yet could not make the rational choice – to vote for Kerry instead. Groups can be “dumb”, even when individuals are smart. 

Solution: Show choices AND consequences, when it matters. 

Overestimation of rare effects

This shows up most often when use case “alternatives” spin out of control. We may be discussing retail transactions, and everyone agrees we should take cash, credit, debit, bitCoin, PayPal and checks. The debate breaks down when we start discussing barter, which is far more complicated (and rare, in commerce). There is no denying that barter happens, AND it may be a waste of time holding up decisions and consensus and progress to handle barter. 

Solution: Add it to the alternative paths, and schedule it for LATER.

Misunderstanding probability

This one I want to make money on. If I explain, I won’t make any money. I offer the following bet, without explanation, to anyone who wishes to take it (the law firm of Finch and Associates, LLC will hold the money and administer the bet, unless they don’t want to ):

I am willing to bet my $1 against your $1 that: If we pick 50 people at random, then at least two of them will share the same birthday (same month and day, though possibly a different year).

If that is not attractive we can make it my $5 against your $1 as long as we pick 70 people at random.

Any takers? Why or why not? I have lots more, open your wallets.

Solution: Which humble reader shall provide?

Thanks for reading, leave any thoughts, and have fun!

Don’t forget to leave your comments below.

* Not my humble readers, who know that they are WAY too smart to fall for this.

** Life is clearly biased in favoring existence over non-existence.

*** Us, and Naegleria fowleri, so don’t get too excited.

**** And humans. Next time you are nervous in public, now you know why.

***** Answer next month. No more scroo’n ‘round, on with Thinkholes!

How to BUSINESS Analyze Stakeholder Requirements

ferrer Sept3 FeatureMany BAs ask me where to get the business requirements when no one has done Enterprise Analysis or even a simple “Business Knead”. “That stuff is above my pay grade”, they say, “and even if it weren’t nobody gives us enough time or information about what is really going on. We barely have time to clean up today’s mess, never mind tomorrow’s.”

“Me three” is my reply. My experience and certification don’t change basic human nature. Even when I am invited to high-level meetings, no one thinks of me as a “business owner” or manager. The checks are written above my head, and many command structures still insist on top down flow only.

Stick with us (thanks to my anonymous class, who inspired months of blogs) as we transcend BABOK by explaining how (and why) to get something from nothing , and in the process raise your pay grade*.

Last month we tried to use ordinary analysis to break down stakeholder requirements driven by the need to cut costs, resulting in something like:

1. Internal Service Costs

  1. Total Costs of Internal Service by Organizational Structure
    1. Costs by Service Provider Department
      1. Costs by Service Provider Team
        1. Costs by Service Provider (???time/effort)
        2. ???Other incidental costs (overhead/supplies)
      2. ???
    2. ???Costs by Service Recipient Department
      1. ???Costs by Service Recipient Team
        1. ???Costs by Service Recipient (time/effort)
        2. ???Other incidental costs (overhead/supplies)
      2. ???
    3. Costs by Service Type
      1. ??? On boarding
      2. ??? Annual Training
      3. ??? IT Help Desk
      4. ??? HR Guidance
      5. ??? More…
    4. Costs by Chances to Save Resources
      1. ???
      2. ???
    5. More ???Cost Views…
      1. ???
      2. ???

2. ???Internal Service Benefits

  1. ???Etc.
  2. ???Left as an exercise for the reader, similar to above yet different.

I was so tempted to expand this list of trees**, but I decided to take a peek at the forest instead. Why?

Although we have tried to expand the original stakeholder requirement, it is still unclear what is or isn’t a priority. The focus so far seems to be on WHO DID WHAT. The BABOK says that BAs have general business knowledge. What do you know about measuring or enhancing employee performance? What are the impacts of singling persons or departments out? Short term? Long term?

It is not clear how knowing how much internal service is being done by whom for where will change costs or improve the business. At best we could decide to re-train (or fire) the lowest performers, and we will discover that (by definition) there aren’t many of those, and once fired, someone else will take their place. There might be a few VERY high performers, but they will not be reproducible as a general rule.

How many Michelangelos does it take to screw in a light bulb? How many non-Michelangelos does it take to paint a masterpiece? It is quite likely that most employees are doing the best they can in the circumstances, with statistical fluctuations over time, but no significant performance differences. 

Blaming (even identifying) the workers to reduce costs is an organizational dead end. Many great leaders reject the use of the “Theory X” approach” (workers are lazy thieves who are best motivated by whippings and emotional abuse). These include Robert Townsend of Avis (“Up the Organization” remains relevant to this day), Douglas McGregor of MIT, and especially Edward Deming (“brought to you by the nice people who made your nice car that you can rely on”) among MANY other quality triumphs. Deming showed that in most cases job performance is randomly distributed among employees over time, once inputs, policies and tools are established.

Another high-level concept worth knowing is that the tyranny of numbers is a risk in any project (“Hey, we are paying $10 per bug found!”). Cutting costs is not a business goal by itself. If it were, the best approach would be to cease operations entirely, achieving zero costs. Finance mavens will recognize that investing zero has “opportunity costs”, and there is no way out – figure out how best to use resources, or stick them in your mattress to rot.

This makes us realize that the stakeholder requirements are not remotely robust or useful as imagined. They represent a literal attempt to monitor internal service costs, perhaps in an attempt to “be fair” and “spread the pain”, with no clue how these costs relate to the business success. 

If we pursue such requirements, we are likely to create a system to track internal service costs that has little or no impact on the quality of decision-making. Worse, it might have too much impact on the quantity of decision-making (“look, department D is giving too much internal service this month, let’s dock their pay to re-motivate them to reduce the service”).

SO, what is the real business need? Cost control obviously matters, but how does that “high level abstract not quite a requirement as stated” relate to possible actual requirements? Let’s use a “MOST” analysis (Missions, Objectives, Strategies, Tactics) and see if it helps:

Let’s agree (for this blog) that many organizations have “high-level” missions that are a little “generic”; something like:

Be Customer Driven
Make Quality Everyone’s Business
Practice Respect For All
Maximize Efficiency, Effectiveness and Profitability

This may seem fluffy and devoid of substance (it is** :)), but we can use it as a starting point to re-imagine the stakeholder requirements. It would seem that the mission to “Maximize Efficiency” is the primary mission in play. Leaving out “Profitability” is the easy to commit error. When I trace to this level some PMs (not you, not you, resemblance to real people is a coincidence) tell me “everyone already knows that, don’t waste your time.” In spite of any resistance, no one can forbid me to know the organization mission, and use the knowledge to add value to stakeholders.

This seems like pure “Root Cause” business need stuff. Root cause stuff can be sensitive to discuss, and requires tremendous diplomacy, facilitation and values (don’t blame people) to do well. That is a different essay for some other day. In an attempt to work with this group of “internal service” stakeholders we will pretend to analyze the reasons that internal service is TOO costly:ferrer Sept3 1Click image to view larger.

OOPS! Depending on the actual root cause analysis (mine is made up for the blog, can you spot the big error?) cutting internal services might hurt effectiveness and profitability. 

What would you do? Don’t hold back, the future of the organization will be impacted one way or another. 

Hmmm…is the problem the root cause analysis, or is there a deeper problem? What is the root cause of this rather un-useful root cause analysis? WHO CAN OFFER AN ANSWER? Will James marry Oneida or stay in Paraguay? Is anybody out there?

Have fun! 

* Pay grade ≠ pay amount – negotiation is a key competency and worth a try :).

** Not ! 🙂

*** A higher quality mission statement might be “Balance efficiency, effectiveness and profitability”. Maximizing everything sounds good (and seems simple) yet is just as hard as “Balancing”. The word “Balancing” does not hide the deeper truth that tradeoffs are usually necessary and too much simplicity can mislead.

Don’t forget to leave your comments below.

How to Analyze Stakeholder Requirements

FEATUREAug6th
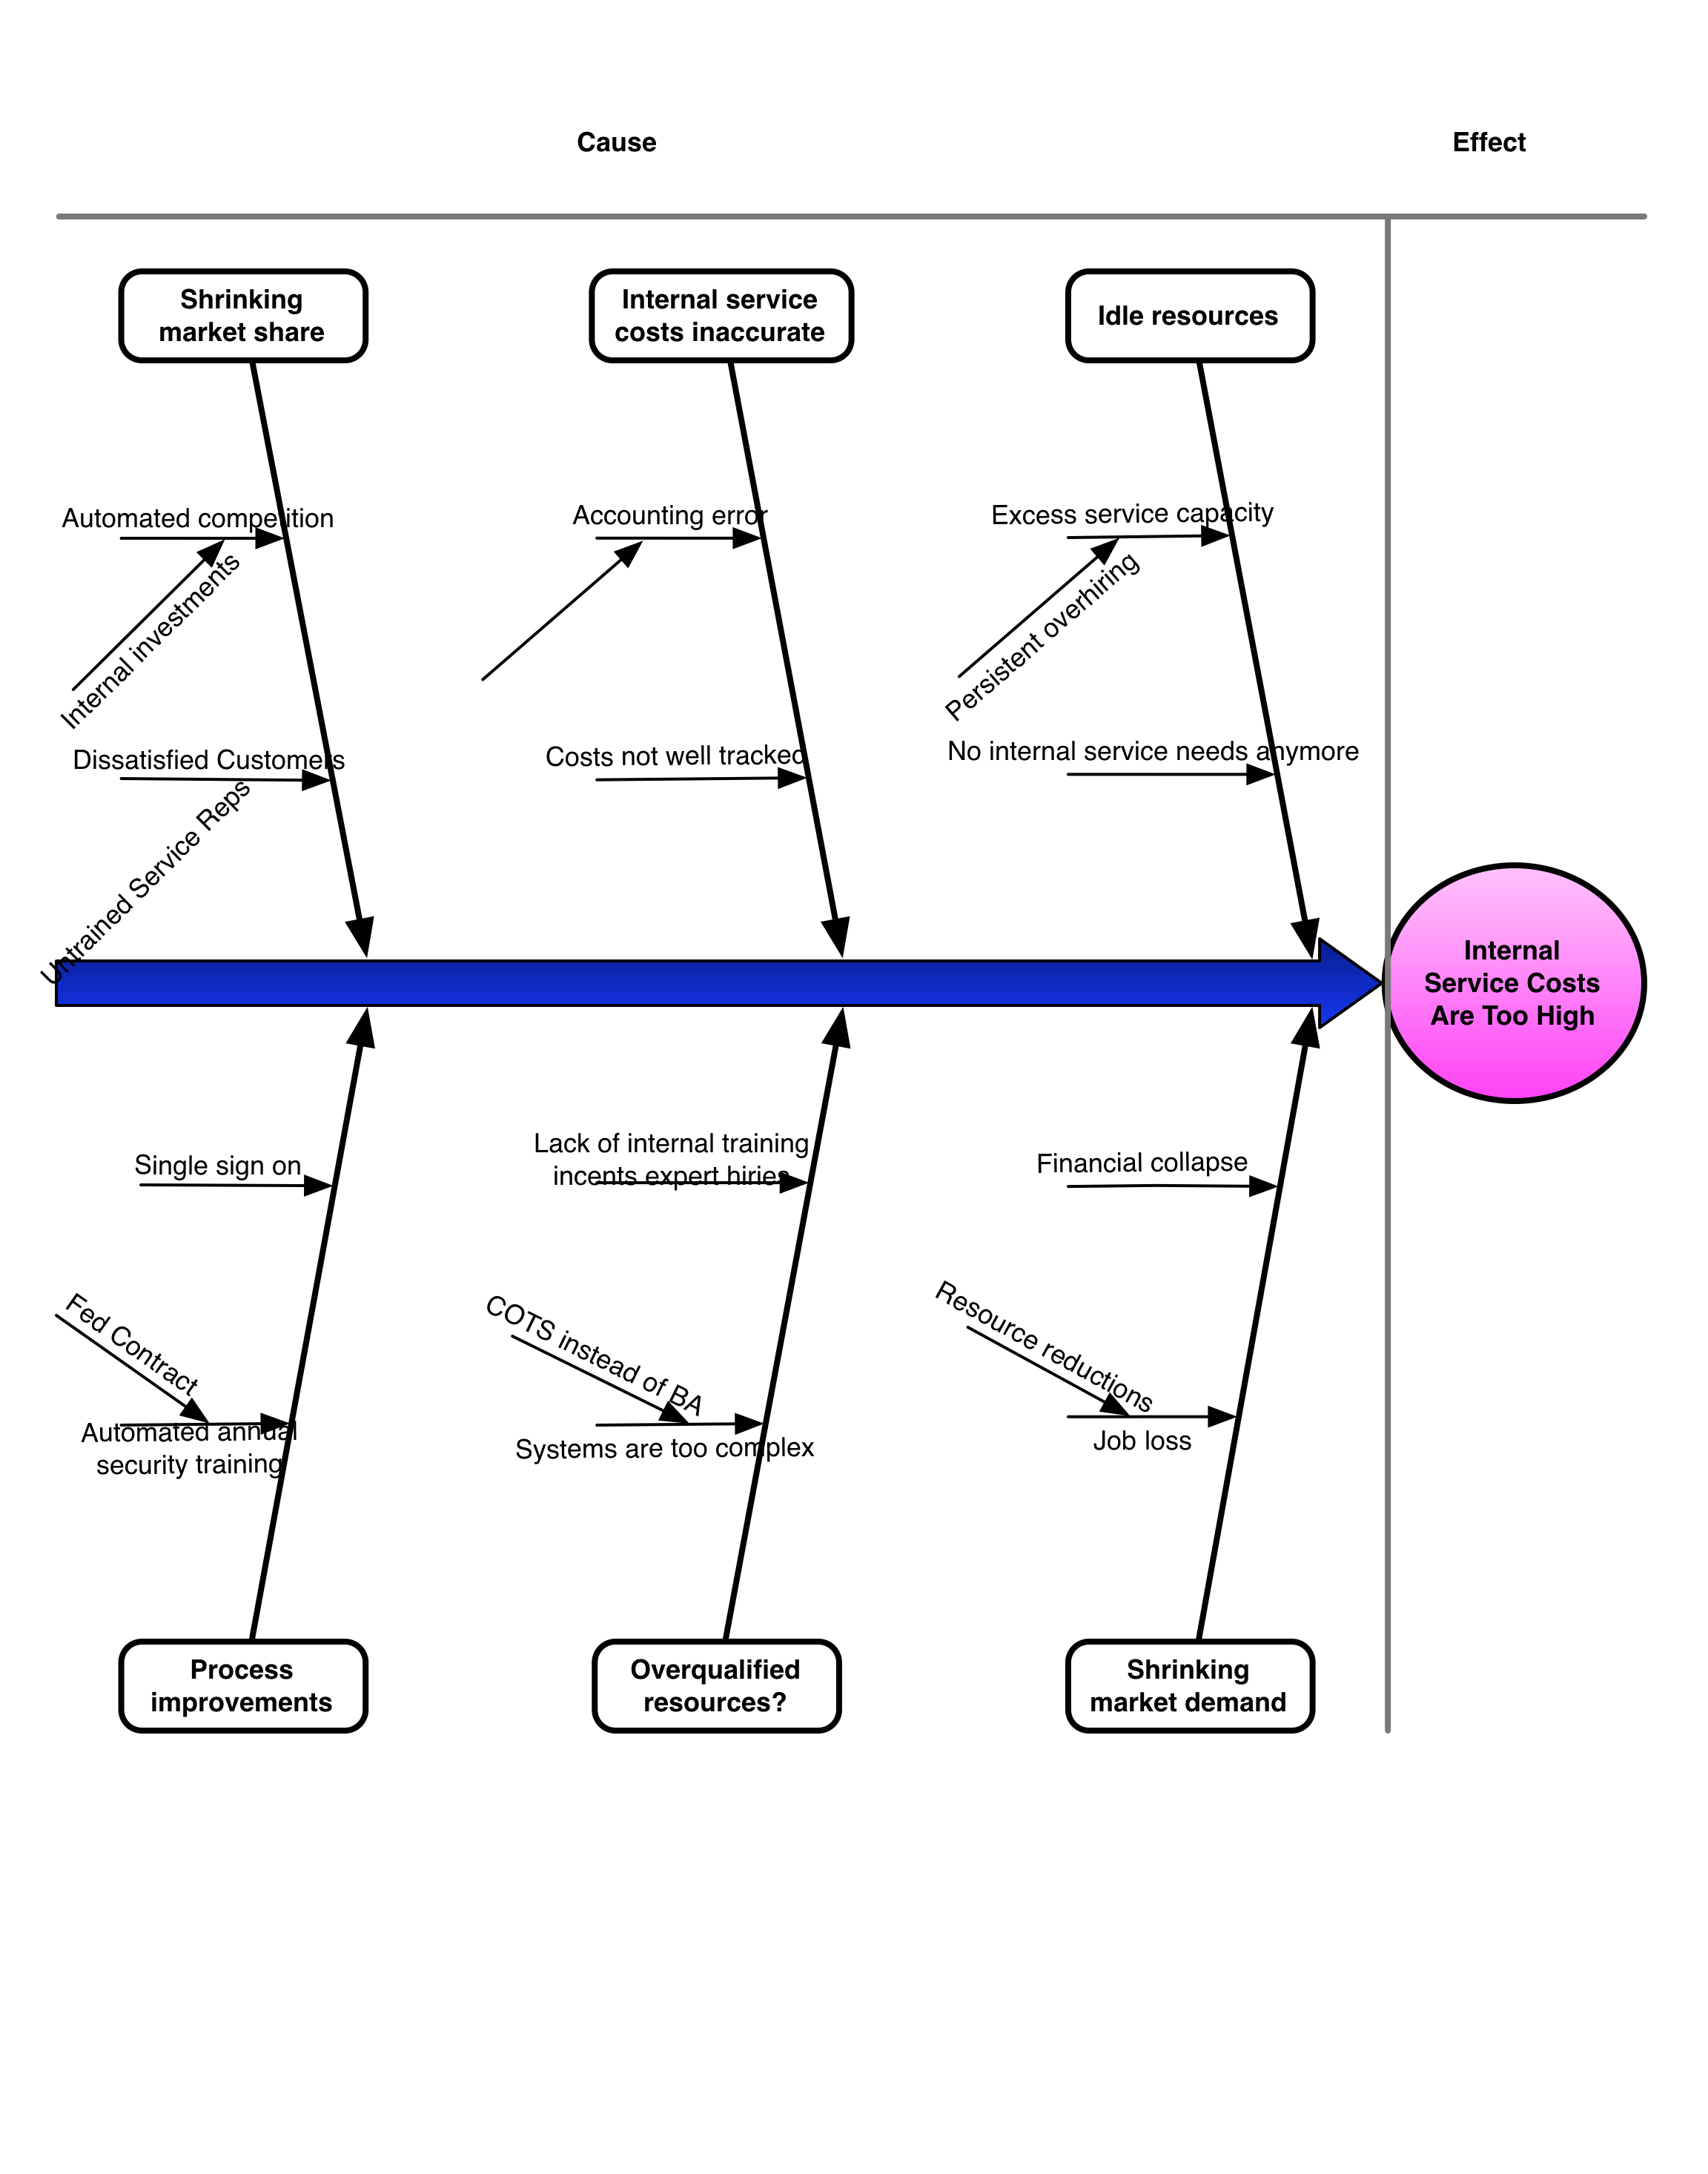
Copyright 2013 Marcos Ferrer

When I was very young I asked my father what he did.  “I’m an analyst.”, he told me.  “What’s that?”, I asked right back.  “I spend my time thinking,” he answered.  “Thinking about what?”, I insisted.  He laughed and replied “All kinds of stuff – anything they want!”. 

I didn’t know what to ask after that.  Thinking about “anything” meant thinking about everything.  I was not yet old enough to know everything, and was overwhelmed at the thought (now I am too old to know everything – it was fun while it lasted). 

In recalling the incident I realized that I do know a lot more about analysis than I used to.  To explain analysis so others can take action in their jobs requires some very hard thinking.  Hard thinking is the BA’s favorite job*.  SO – let’s Analyze Analysis! 

Maybe dictionary.com already explained analysis for us?  Let’s see their definition:

a·nal·y·sis [uhnaluh-sis]

noun, plural a·nal·y·ses [uhnaluh-seez].

  1. the separating of any material or abstract entity into its constituent elements (opposed to synthesis).
  2. this process as a method of studying the nature of something or of determining its essential features and their relations: the grammatical analysis of a sentence.
  3. a presentation, usually in writing, of the results of this process: The paper published an analysis of the political situation.
  4. a philosophical method of exhibiting complex concepts or propositions as compounds or functions of more basic ones.
  5. Mathematics .
    1. an investigation based on the properties of numbers.
    2. the discussion of a problem by algebra, as opposed to geometry.
    3. the branch of mathematics consisting of calculus and its higher developments.
    4. a system of calculation, as combinatorial analysis or vector analysis.
    5. a method of proving a proposition by assuming the result and working backward to something that is known to be true. Compare synthesis.
  6. Chemistry .
  7. intentionally produced decomposition or separation of materials into their ingredients or elements, as to find their kind or quantity.
  8. the ascertainment of the kind or amount of one or more of the constituents of materials, whether obtained in separate form or not. Compare qualitative analysis, quantitative analysis.
  9. Psychoanalysis.
  10. Computers. systems analysis.

Other sources allow us to expand the above:

Wikipedia:

Analysis is the process of breaking a complex topic or substance into smaller parts to gain a better understanding of it.

Applicants (for topics related to analysis)

  • 1.1 Chemistry
  • 1.2 Business
  • 1.3 Computer science
  • 1.4 Economics
  • 1.5 Engineering
  • 1.6 Intelligence
  • 1.7 Linguistics
  • 1.8 Literature
  • 1.9 Mathematics
  • 1.10 Music
  • 1.11 Philosophy
  • 1.12 Psychotherapy
  • 1.13 Signal processing
  • 1.14 Statistics
  • 1.15 OTHER…(emphasis mine)

And, of course, many other authoritative sources, such as BA-elzebub’s Glossary which defines A, BA & MBA (Analysis, Business Analysis, & Monkey Business Analysis).

The question is not about WHAT can be analyzed. ANYTHING might be analyzed.  Priorities change, and focus must shift.  The first question is actually HOW?  How does one DO analysis, business analysis in particular?

BABOK gives a starting point.  It analyzes business analysis by breaking it into parts – in this case, the 6 Knowledge Areas and the 32 BA tasks.  Since our stakeholder has given a “requirement”, let’s look at the “Requirements Analysis” knowledge area.

The first task of “Requirements Analysis” is “Prioritize Requirements”.   It makes sense to work on “first things first”.  How do we prioritize?  This can be especially tricky when presented with stakeholder stated solution “requirements” instead of an explicit business case (see the Schmision, Part I).

Let’s say a stakeholder wants to implement some new reporting.  When asked what information needs to be reported the stakeholder responds “everything” (no, really, it can happen J).  Further elicitation may reveal a short list of ideas or items of interest.  Such an elicitation (forgive any over-simplification) might be stated, documented and confirmed to the stakeholder (not yet analyzed into a solution requirement) as follows:

Department Help Desk needs new reports to help reduce the costs of servicing “internal customers”.  These reports should show everything J, including but not limited to:

Costs of servicing internal customers
Department costs of internal customers served
Team costs of internal customers served
Types of internal service provided and costs
Who gets most internal service
Who gives most internal service
Where we can save resources
More…

Notice that it is not trivial to “prioritize” this requirement.  Prioritization requires more than one requirement.  Perhaps the “prioritization” work can be found by analyzing the list.  “Where we can save resources” seems like a high priority, but what report can tell us this?

This situation is typical of stakeholder requirements of all sizes and complexities. These are often handed out with minimal analysis (“We said what we want”) and with no rational hints about priority (“Do this ASAP”, or “Do all of it, don’t be late”). 

How can we use analysis to add value here?  With one overarching requirement, we work on the one we have.  The Prioritize Requirements task is easy for the moment.  To add value, we start with the stakeholder’s list, slightly modified to simplify and abstract the ideas.  We apply the Specify & Model task, using an outline text model:

Attempt to Analyze Stakeholder Requirements [Stated, Confirmed] for the Everything J About Servicing Internal Customers Report Project – EASICRP:

  1. Internal Service Costs
    1. Total Costs
    2. Costs by Department
    3. Costs by Team
    4. Costs by Service Type
    5. Costs by Service Recipients
    6. Costs by Service Providers
    7. Costs by Chances to Save Resources
    8. More…

Still modeling, we use outline logic (“Some of these things, belong with the others, some of these things just aren’t the same.”) and get:

  1. Internal Service Costs
    1. Total Costs
      1. Costs by Department
        1. Costs by Team
          1. a.    Costs by Service Providers
      2. Costs by Service Type 
      3. Costs by Service Recipients
      4. Costs by Chances to Save Resources
      5. More Cost views …

Still modeling, we use outline “rule of thumb” – if you have one of something, you probably have another.  If you don’t, you may have a gap.  Figuring this out is adding value to the stakeholder’s analysis – “by being more complete, we may reduce requirements risk.  We get something like the following, using ??? for additions by the analyst, pending further analysis and/or validation by stakeholders:


  1. Internal Service Costs
    1. Total Costs of Internal Service by Organizational Structure
      1. Costs by Service Provider Department
        1. Costs by Service Provider Team
          1. Costs by Service Provider (???time/effort)
          2. ???Other incidental costs (overhead/supplies)
        2. ???
      1. ???Costs by Service Recipient Department
        1. ???Costs by Service Recipient Team
          1. ???Costs by Service Recipient (time/effort)
          2. ???Other incidental costs (overhead/supplies)
        2. ???
      1. Costs by Service Type
        1. ??? On boarding
        2. ??? Annual Training
        3. ??? IT Help Desk
        4. ??? HR Guidance
        5. ??? More… 
      1. Costs by Chances to Save Resources
        1. ???
        2. ???
      1. More ???Cost Views…
        1. ???
        2. ???
  2. ???Internal Service Benefits
    1. ???Etc.
    2. ???Left as an exercise for the reader, similar to above yet different.

Although we have expanded the original stakeholder requirement, it is still unclear what is or isn’t a priority.  The focus so far seems to be on WHO DID IT, an approach that has been deprecated by many great (and late) business leaders, including Robert Townsend of Avis (“Up the Organization” remains relevant to this day) and especially Edward Deming.

More trivially, I have unfilled “outline” spots – this often suggests that further analysis can help, but what analysis?  Drilling the “solution” in this case is not giving my inner BA the warm fuzzies.  Thank goodness it only took an hour.

When in doubt, learn more. Next month we illuminate our Stakeholder requirements with traceability to Business Requirements, and discover the source of BA’s increasing popularity.

Food for thought to my thoughtful readers:  One way to understand a thing is to understand what it is not.  The opposite of analysis is synthesis. Does this help you?  Seems to me that synthesis is as much the point as analysis in what we do.  Tell the IIBA, especially if you are a part of the Practice Survey!

* Hob, hob, hob, with thanks to Bob Borden and Jeff Ring of Illinois.

Don’t forget to leave your comments below.

Business Case Clarified – Vision-Schmision Part 5

ferrer April30 IMG01Motivation:
“If you are going to be incomplete, at least nail your most important business process! 

Ingredients:
Business Need
Any Enterprise Architecture not limited to:
Organization (Business) Goals & Objectives
Performance Metrics
Organizational Process Assets
All Solutions [Constructed, Deployed]
Ten Stakeholder Types (and all their ideas)
All Information Available on Risks
Business Analysis Resources As Needed

“Danger, Will Robinson!” If you are wearing a PM hat, your sense of “scoperiety” is about to be violated, but try to relax. This is business analysis, not project analysis.

Welcome to Part V of our series on Enterprise Analysis, AND the use of these tasks are not “sequential” as presented, but highly iterative. ALSO, I remind myself (my readers need no reminder) that we have a gentleperson’s agreement that we don’t have time to be “complete”. All we are doing is trying to improve on “Go Paperless for $10,000,000” (see the Schmision Part 1 for more details).

A good way to get a higher quality “scope” out of the initial vision is to play “what if” with a quality business case. This is because any significant project represents something new to the enterprise “consciousness”. The newness implies risk, uncertainty and many assumptions. Even the constraints are assumptions, especially if the constraints are not analyzed for their impact on potential outcomes. “What if” thinking is one route to making higher quality decisions given uncertainty. * This is especially important if formal feasibility studies will not be done before full project commitment. **

Enterprise Analysis (which includes Requirements Analysis work) led us to Define the Business “Knead”, Assess Capability (and other) Gaps, and Define Solution Approach(es) and Solution Scope(s). We pluralize the solutions on purpose. First of all, we wish to present as professional BAs, offering choices, pros and cons, not opinions, attitudes and personal preferences. Second of all (a major point of this series), the rush to solution” is a key failure mode of large projects. By examining alternatives (see Part IV last month), we begin to understand the true impacts of the solution choices, and the tradeoffs inherent in choosing a specific project scope and set of priorities. 

This is great “pre-project” stuff – you know – requirements as its own “pre-project project”. This kind of practice could maybe improve the quality of the Project Management Office’s “triage”. It might also (my favorite) give the next analyst in line a head start on next analysis steps. There is ALWAYS a next analyst in line, because there are always next analysis steps – pay us now, pay us later). If no professional analyst is assigned, it means that the end users step into the role with a vengeance. Example analysis by end user experts: “This stinks, can’t use it.”

To minimize the need for such expert analysis, we imagine starting the project on the right foot by presenting a high quality business case instead of a weakly analyzed cost justification. In case you forgot, click here for a glance at the “cost justification” from Schmision Part 1.

Now, let’s compare the “just costs” analysis to a business case that resembles the actual business we are in. Notice the beginnings of (and one of the primary purposes of) traceability.

We start by “cleaning up” (analyzing) the Business’ goals and objectives. We do this by reconciling their relationships with each other and with the problems and the opportunities as understood so far (the “Knead” itself). In return we get guidance for how to organize the business case, better understanding across the high level requirements, PLUS feasible “summary” potential.

This analysis following (once again, with the gaps???) immediately suggests gaps. We do this analysis by figuring out that “Some of these things belong with the others”. We continue to add gaps that we (all stakeholders) see, and fill them where we know how.

Goals/Objectives/Issues/Opportunities and their relationships:

  1. Increase 2013 Undergraduate enrollment from 37,213 in Fall 2012 to 41,500 for Fall 2013. DO THIS BY:
    1. Increasing applications from around 49,000 to over 55,000 (how??? How many of the new applicants will be qualified? How many will then accept our offer to attend??? Can we )
    2. Reducing lost applications/applicants (see issues 1, 2 below).
    3. Reducing dropouts (and transfers???) from 3723 per semester to 1500 or fewer. This should result in Undergraduate enrollment levels of at least 38,500 at end of Spring 2014 (relate this to goals above???). DO THIS BY:
      1. Improving student satisfaction from 82% (2012 results) to 90% as measured by the 2013 annual “Student Satisfaction” survey to be given 12/1/2013 (see issues 1, 2, 4 below).
      2. Increase summer school enrollment 10% from 9833 in 2012 to 10,816+ by 2013 (how???).
      3. Attracting more undergraduate students to stay with us in anticipation of continuing their education within our expanding Graduate programs (see Goal B, below):
      4. Increase Fall Graduate enrollment from 12,360 in Fall 2012 to 13,500, to be split between academic departments. Goals are as follows:
        1. Law – 200+
        2. Business – 430+
        3. Media / Arts – 120+
        4. Public Safety (new department) – 320 plus
        5. PhD Programs – 70 plus
  2. Reduce costs even as business grows. DO THIS BY:
    1. Reducing employee turnover from 10% per year to 5% (???How???).
    2. Freezing hiring at 2012 levels (1017 employees) except for:
      1. Except for one new Dean for the new Public Safety department.
      2. While adding 20 contract faculty for new teaching workload (S
      3. While adding 20 contract faculty to offset expected contract attrition (we assume that contract employees and regular employees have the same impact on paper workloads).
    3. Improving employee productivity by XX%??? (see issues 1, 2, 6 below)
      1. By reducing time spent paper (information) handling
      2. ???With improved systems (integrated faculty scheduling, online student registration and class scheduling)???
      3. ???With other system initiatives??? (see issues 4 & 6 below)
    4. Cutting annual document archival costs by 90% for FY 2014 (see issue 5 below).
  3. Improve community relations, as indicated by the annual community feedback session plus a (new) formal survey of the community and trends in feelings and attitudes.: DO THIS BY:
    1. Expanding English as a second language outreach classes from 4 to 16.
    2. Improving student satisfaction??? – See above – students are community members too???). (see issues 1, 2, 4 below)

Known problems and opportunities related to the use of paper include, but are still not limited to:

Specific Issues:

  1. Bottlenecks / slowdowns in the student admission process due to sharing the paper application file (see Admit Student process in Appendix A). Our biggest competitor can give a prospective student an admission decision in less than two weeks, while our average is currently 5 weeks (???This average seems low given some of the delays given below – is this our average when everything goes well???). While we do not know how many students we lose because of delay, surveys show that over 30% of our applicants complain about the delays. Reasons given by applicants for not attending included:
    1. Missing financial aid, acceptance by other colleges, family or health issues, inability to provide a complete (Surveys were limited to applicants in our systems. We are not sure if we lose prospects that never applied on line, because they knew they were too late???).
  2. Lost or misplaced student transcripts delay financial aid. Estimated as around 250 per year never found, new transcript requested, and around 4000 that are stuck in inboxes, new transcript requested, original transcript later found (what happens???) student transcripts delay financial aid. There are other reasons that delay financial aid (missing information from students), which we believe is the cause of half of our 3723 student dropouts last semester. Financial aid delays can stretch for months instead of weeks, and always contribute to admissions decision delays.

  3. To hire faculty requires that anywhere from 10-20+ persons and 3+ academic departments (undergraduate, graduate and professional, and any “related” graduate programs???) examine the prospect’s academic transcripts. Confidentiality & privacy considerations discourage or forbid photocopying or e-mailing the transcripts. It can take from 2 to 12 weeks for the official paper transcript to pass from hand to hand, group to group.

  4. Grades are being computed and delivered by faculty on paper, for entry into a grade reporting system by each department (Dean’s Office). When questions arise about the grade, there is no detail to explain how the grade was awarded. Faculty explains that the criteria for grading are explained and written on the board at the beginning of each semester (every faculty does this???), student complaints to the ombudsman notwithstanding. The student must fill out a form to formally request explanation from the faculty member. The student ombudsman receives about 200 grade related complaints every semester. The number of formal forms submitted each year is less than 5. The reasons for the difference are unclear? There are approximately 37K students enrolled).

  5. Archival costs total $453,000 per year as of 2013. Almost half of these costs seem out of control due to repeated need to access already archived documents. These documents are often related to students who are taking longer than 4 years to finish their degrees. We need policies and electronic search to reduce this repeated manual paper archive searching.

    General Issues:

  6. Departmental managers recently estimated from their own observations that employees spend anywhere from 10% (executives) to 50% of their time finding, moving and re-filing paper documents in support of their more expert administrative and academic work. These include, but are not limited to (are there estimates of quantities, time impacts per document?):
    1. Health care
    2. Counseling
    3. Housing
    4. Part-time work
    5. Recruiting, hiring, firing, benefits administration (and other HR functions)
    6. Regulatory compliance
    7. Legal work
    8. Grading
    9. Ombudsman cases
    10. Veteran’s educational benefits
    11. Fraternity & student organization oversight
    12. Faculty mentoring and counseling
    13. Preparation and follow-up for management meetings
  7. It is anticipated that more specifics are to be discovered if a decision is made to further analyze and detail requirements for a business case.

=================================

We will use the above reconciliation (highest level business viewpoint) to trace an electronic document based solution alternative (AS-IS vs. TO-BE) that we imagined in Schmision Part 4. When we are done, we will (imagine that we) have enough “dough” to imagine a business case, at last. This usually takes the form of a spreadsheet, not provided here . Let me know if you get the idea. I have mostly limited myself to the CRITICAL elapsed time for applicants in the analysis that follows, but could have added in more level of effort and personnel impacts as well.

Admit Student – “Potential Happy” Path(s):

Step # Step Description AS-IS New Step TO-BE(s)?
01 Applicant (potential student) fills out an accurate and complete application package. Applicant fills package on line, System verifies it is complete and accurate, so applicant can correct it before submitting – skip to step 13 (this choice seems out of scope for e-docs, yet maximizes impact on goals and objectives)
02 Applicant mails application package to Admissions Applicant scans & emails package to Admissions – skip to step 9 (in scope for e-docs)
03  U.S. Post Office provides delivery service to Campus Mail Processing twice per day Eliminated 1-7 days elapsed time in most cases.
04  Campus Mail Processing sorts application packages into Admissions delivery box Eliminated 1-2 days elapsed time in most cases.
Campus Mail Processing scans and emails package to Admissions – skip to step 9 (in scope for e-docs)
05   Admissions sends a Mail Pickup Person to Campus Mail Processing twice per day to:

  • Pick up Admissions mail and bring to Admissions department.
  • Deliver Evaluated Applications for copying and distribution to multiple departments
Eliminated 1/4-day elapsed time on average.
Elapsed time lost (10 mins to 1/2 day???)
Level of effort (20 mins to 40 mins???)
06  Admissions time stamps all received mail. Eliminated.
Level of effort (1 hour to 10 hours each day???)
07  Admissions Clerk distributes mail to Application Evaluators. Eliminated.
Elapsed time lost (10 mins to 1/2 day???)
Level of effort (1/4 day to 1/2 day???)
08  Application Evaluator time stamps all received application packages before working on any particular package. Eliminated.
Elapsed time lost (10 mins to 1/2 day???)
Level of effort (10 mins to 3 hrs???)
09  Application Evaluator selects the application package with the oldest time stamp. Time creating and maintaining an accurate paper queue is estimated at approximately 5-10% of Application Evaluator’s time.
10  Application Evaluator determines that the application package is complete. Elapsed time lost (10 mins to 1 hr???)
Level of effort (10 to 15 mins???)
11  Application Evaluator determines that the application package is accurate. Elapsed time lost (1 hr to 10 hrs???)
Level of effort (10 mins to 3 hrs???)
12  Application Evaluator passes the application package to Campus Mail Service inbox for twice daily delivery. Time and effort guesstimated above.
13  Campus Mail Service copies application package for distribution to multiple departments:

  • Academic Advisor’s Office (Verify Academic Qualifications)
  • Financial Aid Office (Coordinate Financial Aid)
  • Veteran’s Aid Office (Coordinate Veteran Aid)
  • Prospect Marketing Office (Coordinate Prospective Student Events)
  • Admissions Office (Communicate Acceptance to Prospect)
  • Housing, Cafeteria, Infrastructure (Prepare for Student Arrival)
  • Student Orientation Office (Prepare for Student Onboarding)
Elimination of manual error and delays before delivery to academic departments may save from 4 to 24 days elapsed time.
Electronic copies will ease sharing of data with agencies and may eliminate as much as 1 day to – 3 weeks elapsed time (Veteran’s takes 3 weeks to scan any unscanned financial aid apps).
  Student Onboarding  
WHEW! I AM REALLY OUT OF TIME. ESTIMATES BELOW OFFER BENEFITS FROM REDUCED ELAPSED TIME:
  Lost prospects that were lost due to clumsy Administrative processes. Estimated by Academics as 15-25%??? of the lost (not all) prospects.
  Prospects lost due to slow Academic processes. Estimated by Administrators as 15-25%??? of the lost (not all) prospects.
  ETC. 🙂

NEXT MONTH:

Something easier and more fun, we hope 🙂

==============================================================

*Bayes’ Theorem is another, and it allows us to measure our beliefs against emerging evidence. Unfortunately Bayes’ Theorem is much easier to apply to search and rescue missions than to complex business projects, which don’t even allow building robust business cases most of the time. The “retrospective” (lessons learned) in Agile is a mild attempt to apply “evidence” to beliefs. We set some priorities (prior beliefs), do some work (experiment and gather data), we learn what happens (“facts”, “evidence” and opinion), and then we update our beliefs (new priorities).

** The full project becomes the feasibility study, with the usual results. One way to make every project work better is to do small pilots (you knew that) before full speed ahead (ready, aim, fire, instead of fire, ready, aim). This makes the “feasibility” attribute of the full project more manageable and less likely to cost the moon.

*** Uh huh 🙂

Don’t forget to leave your comments below.