Business analysis is a critical skillset and operational imperative companies need to prioritize as they look to be profitable and understand how they can make measurable improvements as they scale. This fact is not lost on corporations, either—for example, 72% of manufacturing executives said that they considered advanced analytics to be important, according to a report by BCG.
The construction sector, meanwhile, consistently finds itself in a precarious state in terms of profitability no thanks to employment challenges, influx materials pricing, and the disjointed nature of the construction ecosystem. For example, experts estimate job growth in the construction industry is projected to be at a stagnant 1.1% for ten years (Data USA via Finances Online). Underperformance, Autodesk concludes, is an industry-wide norm with 72% of firms saying projects have taken longer than anticipated—and 44% of firms putting longer completion times into their bids, according to data from Associated General Contractors of America (AGC). In fact, merely 25% of projects came within 10% of their original deadlines, a KPMG report found.
The World Economic Forum (via Autodesk) estimated that a 1% reduction in construction costs could save society $100 billion globally. As the construction sector ecosystem looks to execute projects in a quickly changing environment, these existential challenges warrant organizational changes to better negotiate the trials and tribulations at hand.
We also have to consider the average construction company’s costs to better contextualize these challenges and opportunities. If we assume that the average cost of a construction project is comprised of overhead, materials, tools and equipment, and labor, then focusing on what you can control will help move the needle toward greater profitability. For example, while you might not be able to affect the cost of materials, you can negotiate work to accommodate the resourcing you currently have, and you can make plans for improving internal processes to drive greater efficiency.
I’ve previously written about how project managers in the construction industry should embrace change management, as well as how the industry might adopt big tech’s displaced software engineers to address industry digitization problems, and how the construction industry looking to adopt lean management principles may borrow some of the similar practices from agile software project management.
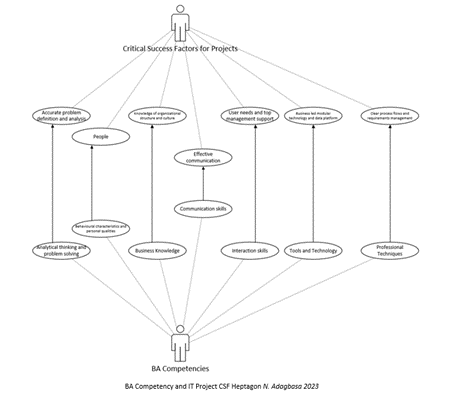
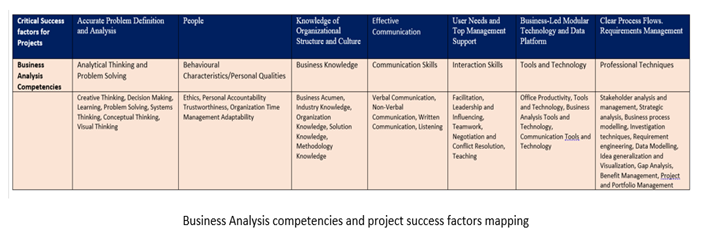
Studies show that business analysts are more prone to support collaboration in agile projects.
With this in mind, in this article, I look to unpack two roles—the Business Analyst and the Inventory Manager—and discuss how a collaboration matrix between these roles can help construction companies work leaner, more efficiently, and drive greater profitability over time.
The Role of the Business Analyst & Why BAs May Be a Critical Construction Industry Hire
Considering construction’s profitability concerns, the role of a business analyst (BA) from the corporate environment is one that construction companies may look to fast-track.
Responsible for “bridging the gap between IT and the business using data analytics to assess processes, determine requirements, and deliver data-driven recommendations and reports to executives and stakeholders,” a BA in a construction company setting can “offer valuable insights to enhance financial planning and resource allocation,” reads the job description for a Senior Construction Business Intelligence Data Analyst role at CBRE Group, a global commercial real estate company, which was available at the time of writing this article.
Consider CBRE’s job posting for some of the job-specific functions a Business Analyst in the construction industry may entail:
- Applying advanced analytical techniques to conduct prescriptive, diagnostic, descriptive, and predictive data analysis on diverse construction-related data, incorporating data from Quickbase, eBuilder, SAP, and Google Sheets.
- Developing dashboards, meticulously maintained [… that] provide real-time insights into construction project data while ensuring these dashboards are user-friendly, intuitive, and deliver vital information to project collaborators (e.g., stakeholders).
- Generating regular and ad-hoc reports for the leadership team, highlighting essential performance indicators, project status, and emerging trends, while translating sophisticated data into practical, actionable insights, incorporating earned value measurement concepts to evaluate project performance.
- Providing meaningful support for annual capital planning by conducting comprehensive analysis of historical data, project costs, and resource allocation, offering valuable insights to enhance financial planning and resource allocation.
- Developing and maintaining strategic forecasts for construction projects, demonstrating data analytics to identify trends and make informed predictions about future outcomes, incorporating earned value measurement techniques to assess project performance and forecast project completion accurately.
- Providing data-driven insights that support critical business decisions, helping to improve operational efficiency and profitability.
Construction forecasting is one critical business process a business analyst may help owners more accurately predict through advanced analytics, historical trends, and advanced technology management (e.g., artificial intelligence).
When they collaborate with other critical business functions (e.g., inventory management, discussed next), greater outcomes may become more easily within reach.
The Role of the Inventory Manager in Construction Projects
An inventory manager in the construction industry (aka: tool crib manager, tool room manager, asset manager, equipment manager, etc.) is responsible for the strategic direction, allocation, storage, and flow of all the physical assets needed to perform construction work—e.g., building materials, tools, vehicles, and equipment.
An inventory manager assures jobsite materials, tools, and equipment arrive on jobsites as they’re needed, are in working order (e.g., tools are properly serviced, materials are not damaged, etc.), and are returned or rerouted across projects as needed to prevent slippage and excess asset turnover.
With an inventory manager at the helm of the construction supply chain, companies might realistically see a 10-12% reduction in labor cost originating from avoiding non-productive idle time or downtime—that is to say, when materials are where they’re needed, manpower doesn’t need to search for them or idly wait for their arrival.
Advertisement
How BAs and IMs Can Work Collaboratively to Drive Better Profitability Outcomes
Now that we’ve discussed what a Business Analyst role may look like in the construction sector, as well as the role of an inventory manager in the same sector, how might these cross-functional teammates work together to drive better profitability outcomes?
Here are five ways:
1. Procurement Strategies
A business analyst, tied into company forecasting, can work closely with inventory managers to establish objectives for procurement strategies and capital investment as well as determine needs based on ongoing inflight projects and company annual goals.
Together, they might reasonably achieve strategic themes when approaching inventory-related financial commitments and implement cost-saving measures, including:
- Appropriate Safety Stock Purchasing – Together, a business analyst and inventory manager can cross-pollinate company-specific analytics related to equipment purchasing, historical trends of project needs, and existing commitments in order to reasonably define policies for shelving inventory and planning for needs (i.e., how much to buy, when). Such a collaboration can help prevent excessive inventory procurement that would otherwise lead to unnecessarily rising overhead, while it can also help facilitate proper procurement to prevent inventory stockouts. What’s more, using advanced analytics via artificial intelligence can help predict future needs.
- Proactive Inventory Audits to prevent needless spending over project lifecycles as well as to provide better long-term inventory management outcomes.
- Deploying cost-centric, advanced inventory management strategies like just-in-time inventory. This method prioritizes strategic, lean operations in order to deploy only what’s needed when it’s needed, preventing excessive inventory procurement (and like above, preventing unnecessarily rising overhead). The method also requires inventory managers to proactively intervene to prevent jobsite hording, hence why inventory tracking (e.g., Bluetooth tags, GPS trackers, etc.) is critical.
- Performing XYZ analysis to calculate: fixed demand (X), fluctuating demand (Y), uncertain demand (Z). Determining these inputs can help inventory managers more effectively achieve more positive outcomes by ranking the frequency and predictability of demand for items over time.
2. Job Costing
In addition to financial forecasts and reporting, business analysts can work with inventory managers to adopt a job costing solution. Job costing in construction refers to the proactive process and steps taken to track the associated costs and revenue of a given project throughout its lifecycle.
The process can be used in inventory management, where inventory managers can apply rental rates (daily, weekly) to equipment that is deployed to the field (either individual or bulk inventory that’s been kitted/bundled and sent at once). Job costing software then calculates the cost accrued for each day (or week) those items are in the field.
This process can help:
- Inventory managers better account and monetize on the equipment they send to their network of jobsites.
- Financially incentivize borrowers to return equipment in a timely manner, reducing the “time on site” of a particular piece of inventory as well as the need for additional safety stock, unnecessary rerouting of equipment from other jobsites, etc.
- Provide additional revenue streams to construction businesses.
3. Reporting
In addition to the business analytics dashboards that a construction business analyst might build for a business owner as discussed in the above-mentioned job description, inventory managers can work hand-in-hand with business analysts to provide additional reporting opportunities, including:
- Tool Management Reports – reports about ongoing usage of inventory (e.g., average “days on site,” as we discussed above, to help make improvements on how inventory is used in the future; service-related alerts, to help proactively take charge of equipment maintenance, improve longevity, and decrease overhead; inventory assigned by jobsite or person, to increase accountability; etc.)
- Asset-specific reports, such as utilization on some smart power tools, which can help diagnose problems before a jobsite-halting breakdown occurs as well as provide quality assurance to customers and inspectors that installations were performed to specification.
4. Interoperability
Construction interoperability is the practice whereby construction systems (e.g., software platforms, apps, processes) interact with each other and the extent to which they possess the ability to operate seamlessly and share information between each other.
A KPMG report revealed that only 16% of executives surveyed say their organizations have fully integrated systems and tools—a serious problem when we consider how fragmented the construction ecosystem is. Consider, too, that only 36% of firms have implemented a process for identifying bad data and repairing it (Autodesk/FMI report).
Together, inventory managers and business analysts can start to build system interoperability that can both provide a single source of truth and prevent cost driving incidents like rework (e.g., from the same Autodesk/FMI report, 14% of all construction rework may have been caused by bad data, creating $88.69 billion in avoidable rework globally).
Possible interoperable systems include:
- Connecting data flow between a project management system (e.g., Procore, Autodesk Construction Cloud, Contractor Foreman, Houzz Pro) and architecture, design, and civil engineering (e.g., Revit, AutoCAD, SketchUp, Bluebeam, Autodesk BIM 360, Civil 3D, ArcGIS, Bentley STAAD, etc.)
- Connecting data flow between inventory management systems and mission-critical systems (e.g., project management, design, etc.)
- Building digital twins (e.g., asset twins, component twins, system twins, process twins) to provide holistic views of cross-network activities, predictive analytics, and real-time data and simulations to aid in decision-making.
5. Planning for Addressing Technical Debt
Technical debt is a phenomenon whereby dependencies one introduces when deploying new software and hardware solutions lead to operational slowdown.
A colleague and I have outlined five ways construction companies can prevent technical debt. A business analyst and/or construction technologist may work hand in hand with an inventory manager to prevent technical debt relative to construction operations from piling up – e.g.,
- They may work with IT to deploy cloud-based systems (i.e., real-time collaboration).
- They’ll deploy inventory tracking hardware to ensure real-time inventory activity is recorded.
- They’ll ensure mobile apps integrate with construction ERPs.
- They may work with the cybersecurity team to ensure proper MDM deployment and data security best practices relative to inventory.
Bottom Line
The construction industry faces some dire operational challenges.
While construction companies might not be able to affect the cost of materials, they can focus on factors they can control—e.g., improving internal processes, empowering the team to work more seamlessly together.
When working collaboratively, business analysts and inventory managers can help companies operate more agilely, more strategically focused, and they can help achieve greater profitability over time.