Tag: BI

The BA Toolkit for Innovation

Folks, it is time to come to terms with one simple fact. In business, disruptions happen. They aren’t new.

You can make an argument that the first disruption happened 66 million years ago when the business of the Dinosaurs was disrupted by the meteor. And, since the start of the Technological Revolution, disruptions are a trend that is picking up.
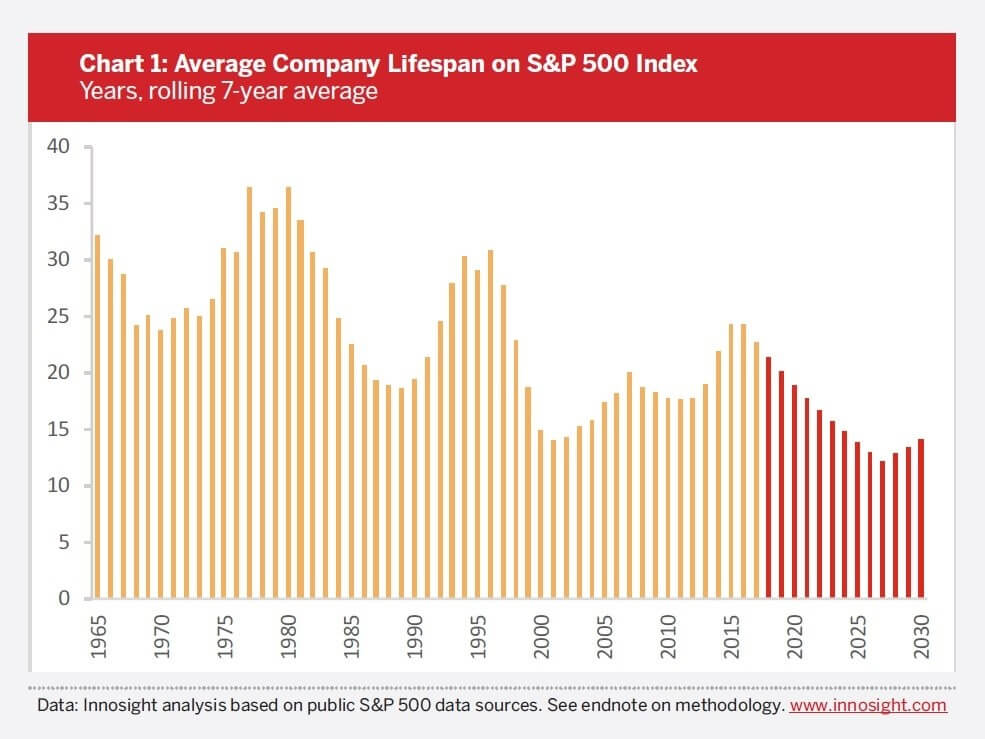
Today, because of increases in technology, available capital and global competition, they are prevalent than ever. Need proof? Look at the graph below brought to you curtesy of Innosight. Clearly, the trendlines on the average corporate lifespan are trending down.
Steve Palmer Apr23

Source: Innosight

Today, 93% of Executives know their industry will be disrupted within the next 5 years according to research performed by Accenture. Yet oddly enough, only 20% feel like they are ready for it. But, just as your corporate executives begin to belt out the lyrics the Mariah Carey’s “Hero” at their favorite local late-night karaoke spot, the Business Gods have delivered to them the hero they needed.

That hero’s name? The Business Analyst!

Business Analyst – Hero for Hire

OK, so, business analyst is more of a role than a person. But however you slice it, it is indispensable in the modern business climate.
We have a saying at Ever Evolving. Never launch an initiative that you don’t know will succeed. The best way to end up on the short side of that corporate lifespan chart above, is to raise a big fuss over something that nobody cares about. And it happens all the time.

There was the Ford Edsel. Microsoft Vista. BlackBerry Storm. Apple Newton. Shall I continue?

Okay. Facebook Home. The Alliance of American Football. Microsoft ME. Windows Phone.

Man, Microsoft has trouble with their product launches.

Anyway, still continuing… Sony Betamax. “New” Coke. Google Plus. Qwikster. Blockbuster Digital.
Sometimes companies launch pet projects that never find a market. Sometimes they see a new threat enter the market space, and they hurry to meet the challenge by launching prematurely. Either way, they both end in disaster. Some companies recover. Others don’t. But they are all avoidable.

And that’s where the BA comes in. Through their use of metrics, indictors, balance scorecards, and all the tools that you already know and love, you can prevent that bad launch. Through the use of small-scale experiments, or what we call Profit Scalability Pilots (PSPs), and timely and appropriate metrics, the BA can gage market interest. Allowing the Titanic to swerve and avoid that iceberg. Or blowing up a model Hindenburg before inviting in the crowd.


Advertisement

Through those experiments, you can learn key insights – such as:

  • What users are really interested in my product?
  • What features are the most important to our userbase?
  • How much value is my product providing its intended audience?
  • How likely is this product to succeed?

How Can You Do It?

The key is to capture that information before you launch. Companies need to provide safe space for new ideas to fail internally. Internal product failures are learning experiences. They bring new insights into your markets and build new capabilities. External failures are embarrassing and cost people their jobs. That’s where the BA comes in. They steer the ship towards the former and away from the later.
You work with your product developers, your sales staff, your marketing gurus and project managers to determine what insights are needed. You work with your PMs to identify the targeted user groups and determine which profitability metrics need to be captured and tracked. You work with your marketing staff to gather and track metrics about how the messaging is received. You track develop tasks to identify whether the build out is proceeding according to plan.
And that’s where the small-scale experiments come in. Call them what you want – whether you like our idea and call them a PSP or if you subscribe to the Eric Ries’ method and call them a Minimal Viable Product – the goal is to get something small released soonest to learn about the market. Learn about the challenges. And then track the metrics over time using your Balanced Score Card. Leverage your indicators to predict the effort’s likelihood of success. And then presenting that information to your corporate leadership.

Want to Hear More?

This is a topic near and dear to my heart. Which is why you’ll be able to hear me speak on it at two upcoming Project World Business Analyst Summit events. The first one is in Washington, DC, where I’ll be presenting on April 30th at 1:15pm in the Salon C room. The title of my talk is Analyzing Innovation Across Business Lines. Tickets are on sale now for the event, and they can be purchased on the Project Summit Business Analyst World website by clicking the “Register Now” button.
If you can’t make DC, that’s OK. Because the real fun is happening the following month in Toronto. In Toronto I’ll be presenting the same talk (with maybe a few new jokes?) on May 27th from 2-3pm. I’ll be following that up the following day, May 28th, by presenting Innovation: The New Currency of Business which highlights why it is imperative for your organization to focus on new initiatives and product lines. And then I’ll be closing the week with a full-day workshop on May 30th. The workshop, titled Charting a Course Through the Innovation Minefield, will provide a deep-dive on the various stages within a corporate innovation pipeline. And it will highlight where in the process those PSPs come into play, where the metrics are tracked, when the indicators are brought up, and exactly where and how the BA provides their value. Tickets for Toronto are also on sale, and you can find them here. Again, just click on the “Register Now” button on the landing page.

5 Killer Questions Types For Digital Transformation

A recent article concludes that for an organization to get the desired results from their digital initiatives,

such as data analytics, predictive analytics, machine learning, AI, etc., data scientists have to ask the right questions.[i] The article was written as a guide for data scientists to help them ask questions to get at the business decisions needed to be made when developing predictive models for these applications.

However, the article’s questions are stated in a way that might cause even the most informed business stakeholders to scratch their heads. If most decision-makers can’t answer them knowledgably, what can the organization do? Get BAs involved, of course! Having a BA participate in the question and answer sessions can alleviate a great deal of misunderstanding and help ensure success with digital projects.

This article imagines that for each of the 5 question types, there is a three-way conversation with a data scientist, a business decision-maker, and a BA. The questions the data scientist asks are from the article, which the BA rephrases to be more easily answered.

Type 1 – Alignment with the organization’s goals and strategic direction

Data scientist to business stakeholder – First things first. What exactly do you want to find out with this digital effort?

Business stakeholder to data scientist – I’m trying to predict sales of a new product we’re thinking of launching.

Business analyst to business stakeholder:

I’m sure this project can help with that effort. But before we talk about specifics of the types of information you’re looking for, what is the business need for this effort? That is, what problems are you trying to solve? Let’s make sure this initiative, which is not going to be an easy undertaking, will address your need. Perhaps there is a quicker, less costly way to achieve your goals. And I have some related questions that will give us more context:

  • How does this effort align with the strategic direction of the organization?
  • What are does the organization do well that will help ensure the project’s success and minimize risks?
  • How will this project help overcome some of the things we don’t do so well?
  • What opportunities are out there and how can the organization take advantage of them?
  • What should we be worried about? How are competitors, for example, doing with their digital initiatives?

Type 2 – Scope of input needed to create and train models

Data scientist to business stakeholder – Where will your data come from?

Business stakeholder to data scientist – I’m sorry, I don’t know the names of the specific databases. I thought I was here to make business decisions, not answer questions best answered by the IT folks.

Business analyst to business stakeholder – At this point we don’t need to know the names of the specific databases. What we mean by where the information will come from are things like:

  • Which business areas will be involved in this project?
  • Which stakeholders will have input into the decisions affecting the creation of the models?
  • Given that this effort will affect divisions in different parts of the world, who will establish the business rules?
  • What types of information will come from other sources, like social media and Google analytics?

Advertisement

Type 3 – Data presentation

Data scientist to business stakeholder – What data visualizations do you want us to choose?

Business stakeholder to data scientist – I’m sorry, I don’t understand what you mean. Do you mean like how I want to see the data? If so, I don’t know. What are the possibilities?

Business analyst to business stakeholder – There are a lot of tools that will take the data and interpret the results for you. They help you make sense of the tons of data you’ll be presented with. They can help you analyze data, point out anomalies, and send out alerts that you specify. They can be in the form of charts, dashboards, or whatever, but keep in mind that if they are hard to read, they will be meaningless to you. I can show you some examples and the pros and cons of such things as animation and use of images, but first let’s talk about the information itself.

  • What results are you hoping to get?
  • What type of predictions about your customers would be helpful? Your products?
  • What types of trends would be helpful to you in making business decisions?
  • What types of exceptions do you want to be alerted about?
  • What information do you want that’s actionable vs. historical?

Type 4 – Statistical analysis leading to the desired outcomes

Data scientist to business stakeholder – Which statistical analysis techniques do you want to apply?

Business stakeholder to data scientist – Well, statistics is not my strong suit. What are my choices?

Data scientist to business stakeholder – Regression, predictive, prescriptive, and cohort, and there are others, like descriptive, cluster.

Business stakeholder to data scientist – blank stare

Business analyst to business stakeholder – Maybe I can help here. These types of statistical analyses have a number of similarities. They include use of historical data, algorithms, models to train the machines, and business rules. Not to oversimplify and at a very high level, all predictive models make use of historical data and algorithms to predict future outcomes.

Here are questions based on examples of different outcomes using different statistical analysis:

  • What groups of customers do you want to target? Cluster analysis classifies data into different groups and can help you target certain customer groups.
  • What types of trends do you want to track? Cohort analysis allows you to compare how groups of customers behave over time.
  • What kinds of recommendations might you want as a result of the analysis? Prescriptive analysis not only predicts future outcomes, but it will “prescribe” or recommend the best course of action.

So to answer the question we need to understand what you’re trying to accomplish. We’ll let her (nodding to the data scientist) figure out the most appropriate analysis method and tool.

Type 5 – Creating a data-driven culture

Data scientist to business stakeholder – How can you create a data-driven culture?

Business stakeholder to data scientist – We already have a data-driven culture. Everyone in this organization understands how important data is to our ability to survive as an organization.

Business analyst to business stakeholder – This might be more complex than it first appears. In order to use historical data, which we need to do regardless of the chosen algorithms, it needs to be cleansed. Cleansing is needed to make the data predictive, and cleansing data takes lots of time and money. And it’s the last thing anyone wants to do. So I have some questions for you:

  • What’s the organizational commitment to cleansing dirty data?
  • Who will decide how clean the data needs to be? How clean is clean enough?
  • Who will decide who owns the data when the same data exists in multiple databases? In order to get the outcomes we want, there needs to be one single source. If the same data exists in multiple databases, someone needs to be its sole owner.

In sum, we’ve provided questions within 5 question types. However, to be effective, we BAs need to learn as much as we can about the digital world—about the world of digital transformation and what it means for the organization. We need to immerse ourselves in research and journal articles and think of how to make sense of it for our organizations. We need to think of digital projects from both the data scientist and business perspectives. And we can do that. After all, we’re BAs and that’s what we do best.


[i] Your Data Won’t Speak Unless You Ask It The Right Data Analysis Questions, By Sandra Durcevic in Data Analysis, Jan 8th 2019, https://www.datapine.com/blog/data-analysis-questions/

5 Business Problems You Can Solve Using SQL Temporal Tables

It’s 4:30 pm on Friday and Mr. Manager comes along to tell you that he needs you to run some important ad-hoc analysis for him.

Previously this meant having to stay late at the office, writing cumbersome queries to extract business information from transactional data.

Lucky for you, you’ve recently started using Temporal Tables in SQL Server ensuring that you’ll be able to answer your boss’s questions and still make it to happy hour for $3 margaritas.

Sound like a plan? Keep reading below!

The Data

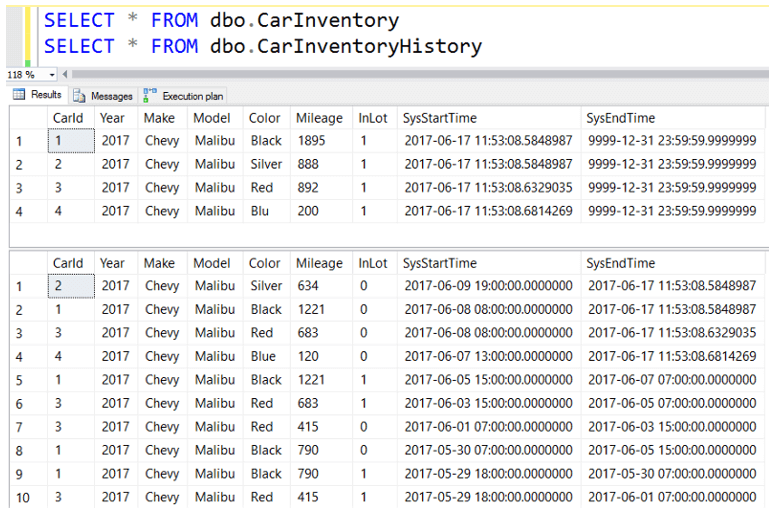
For these demos, we’ll be using my imaginary car rental business data. It consists of our temporal table dbo.CarInventory and our history table dbo.CarInventoryHistory:

Wagner 102617 a

I’ve upgraded my business — we now have FOUR Chevy Malibus available for you to rent

Business Problem #1 — “Get me current inventory!”

To get our current inventory of rental cars, all we have to do is query the temporal table:

SELECT * FROM dbo.CarInventory

That’s it.

I know this query seems lame — it’s just a SELECT FROM statement. There are no FOR SYSTEM TIME clauses, WHERE statements, and no other interesting T-SQL features.

But that’s the point! Have you ever had to get the “current” rows out of a table that is keeping track of all transactions? I’m sure it involved some GROUP BY statements, some window functions, and more than a few cups of coffee.

Temporal tables automatically manage your transaction history, providing the most current records in one table (dbo.CarInventory) and all of the historical transactions in another (dbo.CarInventoryHistory). No need for complicated queries.

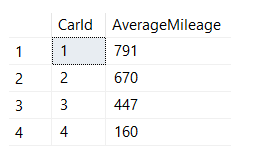
Business Problem #2 — “How many miles on average do our customers drive each of our cars?”

In this example, we use FOR SYSTEM_TIME ALL and a plain old GROUP BY to get the data we need:

SELECT
    CarId, AVG(Mileage) AS AverageMileage
FROM
    dbo.CarInventory FOR SYSTEM_TIME ALL
WHERE
    InLot = 1 — The car has been successfully returned to our lot
    AND SysStartTime > ‘2017-05-13 08:00:00.0000000’ — Ignore our initial car purchase
GROUP BY
    CarId

Wagner 102617 b

Some cars get driven a lot more. Causation or correlation?

FOR SYSTEM_TIME ALL returns all rows from both the temporal and history table. It’s equivalent to:

SELECT * FROM dbo.CarInventory 
UNION ALL 
SELECT * FROM dbo.CarInventoryHistory

Once again, there isn’t anything too fancy going on here — but that’s the point. With temporal tables, your data is organized to make analysis easier.

Business Problem #3 — “How many cars do we rent out week over week?”

Here at Wagner Car Rentals we want to figure out how often our cars are being rented and see how those numbers change from week to week.

SELECT
    CurrentWeek.CarId,
    CurrentWeek.RentalCount AS CurrentRentalCount,
    PreviousWeek.RentalCount AS PreviousRentalCount
FROM
    (
    SELECT
      CarId,
      COUNT(*) AS RentalCount
    FROM
      dbo.CarInventory FOR SYSTEM_TIME FROM ‘2017-06-05’ TO ‘2017-06-12’
    WHERE
      InLot = 0 — Car is out with the customer
    GROUP BY
      CarId
    ) CurrentWeek
    FULL JOIN
    (
    SELECT
      CarId,
      COUNT(*) AS RentalCount
    FROM
      dbo.CarInventory FOR SYSTEM_TIME FROM ‘2017-05-29’ TO ‘2017-06-05’
    WHERE
      InLot = 0 — Car is out with the customer
    GROUP BY
      CarId
    ) PreviousWeek
    ON CurrentWeek.CarId = PreviousWeek.CarId

Wagner 102617 c


Advertisement

In this query, we are using FOR SYSTEM_TIME FOR/TO on our temporal table to specify what data we want in our “CurrentWeek” and “PreviousWeek” subqueries.

FOR/TO returns any records that were active during the specified range(BETWEEN/AND does the same thing, but its upper bound datetime2 value is inclusive instead of exclusive).

Business Problem #4 — “What color cars are rented most often?”

We’re thinking of expanding our fleet of rental vehicles and want to purchase cars in the most popular colors so we can keep customers happy (and get more of their business!). How can we tell which color cars get rented most often?

SELECT
    CarId,
    Color,
    COUNT(*)/2 AS RentalCount — Divide by 2 because transactions are double counted (rental and return dates)
FROM
    dbo.CarInventory FOR SYSTEM_TIME CONTAINED IN (‘2017-05-15′,’2017-06-15’)
GROUP BY
    CarId,
    Color

Here we use CONTAINED IN because we want to get precise counts of how many cars were rented and returned in a specific date range (if a car wasn’t returned — stolen, wrecked and totaled, etc… — we don’t want to purchase more of those colors in the future).

Wagner 102617 d

Business Problem #5 — “Jerry broke it. FIX IT!”

The computer systems that we use at Wagner Car Rentals are a little…dated.

Instead of scanning a bar code to return a car back into our system, our employees need to manually type in the car details. The problem here is that some employees (like Jerry) can’t type, and often makes typos:

SELECT * FROM dbo.CarInventory FOR SYSTEM_TIME ALL WHERE CarId = 4

Wagner 102617 e

Having inconsistent data makes our reporting much more difficult, but fortunately since we have our temporal table tracking row-level history, we can easily correct Jerry’s typos by pulling the correct values from a previous record:

;WITH InventoryHistory
AS
(
    SELECT ROW_NUMBER () OVER (PARTITION BY CarId ORDER BY SysStartTime DESC) AS RN, *
    FROM dbo.CarInventory FOR SYSTEM_TIME ALL WHERE CarId = 4
)
–SELECT * FROM InventoryHistory
/*Update current row by using N-th row version from history (default is 1 – i.e. last version)*/
UPDATE dbo.CarInventory
    SET Color = h.Color
    FROM
      dbo.CarInventory i
      INNER JOIN InventoryHistory h
        ON i.CarId = h.CarId
        AND RN = 2

Wagner 102617 f

Typos fixed!

Although we could have fixed this issue without using a temporal table, it shows how having all of the row-level transaction history makes it possible to repair incorrect data in more difficult scenarios.

Conclusion

Temporal tables are easy to setup and make writing analytical queries a cinch.

Hopefully writing queries against temporal tables will prevent you from having to stay late in the office the next time your manager asks you to run some ad-hoc analysis.

The Algorithmic Business Analyst

Fortune introduced the term “Algorithmic CEO” in 2015. The trends we have seen in the last two years have only added credibility to that term.

Analysts have been talking about how algorithms will transform enterprises. We have seen several new businesses launched with focus on machine learning, cognitive computing and artificial intelligence. We have also seen several existing businesses going the algorithmic route, by investing heavily in technology that relies on algorithms. These are typically cases where advanced big data analytics solutions are being used to optimize operations, or to improve customer experience.

The algorithmic age is forcing everyone – including the CEOs, CMOs and CIOs – to find a new balance. What about the Business Analyst who has been the bridge between “business” and “technology” all these years? To survive and thrive in this algorithmic age, what skills does a Business Analyst require? One way to answer this is to look at the five different domains that Project Management Institute (PMI) has defined for Business Analysis, and see what additional skills or knowledge are required.

1. Needs Assessment

The Needs Assessment domain relates to understanding a business problem or opportunity, and evaluating various inputs to help develop an effective solution. This assessment is typically crucial to get funding approved and have the project initiated.

The Business Analyst needs to be abreast of the technology trends that are driving the algorithmic age – big data, cloud computing, artificial intelligence, machine learning, internet of things etc. The Business Analyst should be familiar with the nuances of the trends that are most relevant for the project. This is essential to articulate the business opportunity in a relevant manner.

The algorithmic age is heavily dependent on data. The Needs Assessment will most likely require data to provide justification for the initiative, or to showcase how data can be used to solve a problem, or how data can be used to improve the business outcomes. The Business Analyst, hence needs to be proficient at identifying the potential of data, and to tell a story using data. The ability to build a data-driven business narrative to support a business case is crucial.

One of the challenges of algorithmic solutions is to be able to evaluate if the solution met its objectives. This evaluation process often is as complex as building the solution itself. As part of the Needs Assessment, the Business Analyst should be able to cover the expected evaluation process, so that the project team can plan for it.


Advertisement

2. Planning

The Planning domain comprises of all activities related to effectively managing all the business analysis activities such as establishing requirements management, requirements traceability, change control, document control and acceptance criteria.

Establishing acceptance criteria is an area where there could be additional complexities for an algorithmic project. The Business Analyst is expected to translate the business objectives to the goals of a specific algorithm. Defining this goal may need to clearly define the data conditions and boundaries. It may be required to do an extensive study of the business data to be able to come up with these goals. Also, a simulation platform may be required to run an algorithm against data. The Planning should also cover if there is need for such additional platforms, or additional data.

3. Analysis

The Analysis domain focuses on elicitation, analysis, decomposition, acceptance, approval, specification and validation of requirements.

The requirements may need to be defined in the context of the technology trend driving the algorithmic initiative. The Business Analyst’s expertise in the technology trend, hence is relevant in Analysis too.

The Business Analyst needs to be data savvy to be relevant. Depending on the organization and complexity of the project, there may be a Data Analyst on the project. Even if there is a separate Data Analyst role, the Business Analyst needs to have certain level of proficiency in data analysis and data visualization. The Business Analyst will be expected to put in a structure around the analysis done by the Data Analyst. For example, the Business Analyst should be able to drive discovery of data correlations, trends and outliers – to build a data story.

What about user stories, use cases, process flow diagrams and everything else that Business Analysts typically prepare? They are all still important. The Business Analyst will in fact need to go one level deeper as all these standard artifacts will also need to get connected to the data story.

4. Traceability and Monitoring

The Traceability and Monitoring domain related to activities needed to manage the lifecycle of requirements. The requirements lifecycle, and the tasks to manage the lifecycle are no different for an algorithmic project as compared to a standard project. The artifacts used to capture requirements could be different, but the process remains the same as for a standard project.

5. Evaluation

The Evaluation domain relates to activities that assess how well the solution met the requirements and business needs. Typically, a Business Analyst does evaluation by running some tests or by reviewing the test results from a Quality Assurance team or by reviewing a demo of the product or feature. While these still hold good, there are additional tasks required in the case of an algorithmic project.

Once the solution has been built, the Business Analyst should be able to run the algorithm against realistic data, and see whether the algorithm is meeting its goals. Depending on the complexity of the project, this may need additional infrastructure, and involvement from other team members. If the algorithm fails to meet its goals, the Business Analyst may be required to do additional data analysis and identify the conditions under which the failure occurs.

Summary

The standard rigor expected for Business Analysis applies to the algorithmic projects as well. However for a Business Analyst to really thrive in this age, it is important to have these additional skills and interests.

  1. Ability to translate business goals to relevant metrics
  2. Passion for data analysis
  3. Deep interest in the technology trends driving the algorithmic age

With these three in place, an already successful Business Analyst is bound to succeed, and take the organization further in its algorithmic journey!

How to Discover Useful Requirements for Business Intelligence

“My users are asking for a report, but how do I make sure I truly understand their needs and properly convey that to the rest of the delivery team?”

Asking for a report is great, but it is a loaded word. People use the word “report” to mean many different things.

A report is a solution in search of a problem. You may know what your stakeholders want on the report, but until you identify why they want the report, you enable their solution seeking.

When you want to understand a stakeholder’s business intelligence needs completely, the following steps often prove very helpful:

  • Start with the questions stakeholders want to answer and decisions they want to make
  • Focus on value and feasibility to determine what to do next
  • Dive into detail only when you need to

Start with Questions and Decisions

When your stakeholders ask for a report, you want to know why they want that report, but you do not want to ask why. Why not?

Asking “why do you need a report?” is not going to provide you with the key insights and information you need and may make your stakeholders think you do not believe they have a need at all.

To avoid that uncomfortable situation, I have found that Socratic Questioning is a good route to go. The question I like to start off with is “What questions are you trying to answer or what decisions are you trying to make?”

When your stakeholders describe the questions/decisions, listen for phrases such as:

  • I want to know…
  • I want to decide…
  • I want to determine…

These help to identify the initial big chunks of value you can deliver in your business intelligence efforts.

Say you are working on a product to allow the audience at Olympic events to vote on the competition – say platform diving – and your stakeholders want to incorporate reporting into that product.

You talk with your stakeholders and find out that they want to know how votes can vary depending on characteristics of the audience or the competitors. That may result in the following things that you want to explore:

  • I want to know if audience members vote differently based on their gender
  • I want to know if audience members favor athletes from their country
  • I want to know if audience members evaluate athletic performances the same as judges
  • I want to know if audience member age impacts how they evaluate performances.

You can easily capture these in a user story, job story, or another template of your choice. The key is that you know what your stakeholders hope to accomplish with the reports, so you can guide the discussion to find out what your stakeholders hope to accomplish.

When you have those conversations, listen for nouns. They represent the pieces of information you need to know. Also listen for phrases such as “by gender” or by country They indicate how to organize the data, including what dimensions you may need.

In our examples above, the nouns you will most likely pick up on are audience members, athletes, and judges. The dimensions then may be audience member gender, audience country, athlete country, and audience member age.

Focus on Value and Feasibility

Once you have identified what you want to work on, you need to decide the order in which you work on it.

Start by prioritizing the questions and decisions your stakeholders are interested in based on value. Which of those questions and decisions are most vital to your stakeholders’ objectives? It may be the question/decision that provides your stakeholders the biggest lift or is most critical to address other questions and decisions.

Then, consider feasibility. Feasibility focuses on whether the data you need to address the questions and decisions is availability and organization of the available information. If the information is not readily available, consider alternative methods and their difficulty in obtaining that information.

Some pieces of data may present some substantial risks from the perspective of whether you will be able to get that data. If that data is critical to some of the more important questions/decisions, you may decide you need to tackle that data first.

Feasibility also drives the order in which your team delivers the data for a specific question/decision. As a result, you may provide overall prioritization of which questions/decisions to address in what order, and then leave it to your team to decide the order of the smaller bits of work necessary to deliver the ability to answer a given question or make a specific decision.

Dependencies play a part in considerations of feasibility. Often the answer to one question becomes an input to answer another question, so you have to consider those interdependencies when you decide the order of the questions you tackle.

Prioritization is most effective when it is a team discussion. Start with which questions you want to answer or decisions you want to make first, but then revise that order based on the feasibility involved in getting the data necessary for those questions or decisions.

Only Dive Into Detail When Needed

I noted above that you want to listen for nouns and pointers to possible dimensions. Noting what comes up during the normal course of conversation is ok, just avoid the temptation to dig too deep too soon.

You do not know which stories you are going to need to do, so you do not want to expend too much effort fully understanding stories you are not going to do. When do you dig into the details?

When you have initial conversations with your stakeholders to understand the information they seek, you may sketch out a very rudimentary report during the conversation to make sure you understand what they are asking for. Stop when you have enough information to determine what order you want to deliver those questions and decisions.

In some cases, you may need to dig a little bit if you identify a piece of data which may prove a somewhat difficult to obtain.

Wait to delve into all the details of the data (definitions, transformation rules, valid values, or other factors) until you are preparing information for a team to deliver the necessary data to answer a question or make a decision.

Business Intelligence Can Be Done Iteratively

It is possible to deliver data warehouses in an iterative, incremental fashion. The key to making that happen and work is to organize your increments around questions your stakeholders want to answer or decisions they want to make. Then consider value and feasibility to prioritize those questions/decisions, and avoid the temptation to dive too deep too soon.

What experiences do you have working on business intelligence projects? Leave your thoughts in the comments.