
Tag: Business Intelligence

6 Things Every Business Analyst Should Know About the World of Data

You must have heard of Big Data, Data Science, Business Intelligence, Data Driven. Maybe not. What do all these cool words mean for a Business Analyst?

Is there any difference between the Business Analyst and Data Scientist?

1. Definition of Big Data, Data Science, Business Intelligence, & Data Driven

Let’s define each of these concepts

  • Big Data – Big data is high volume, high velocity, and/or high variety information assets that require new forms of processing to enable enhanced decision making, insight discovery, and process optimization. (Ref1-Gartner’s definition)
  • Data Science – It is a concept to unify statistics, data analysis, and their related methods to understand and analyze actual phenomena. (Ref2- Hayashi, Chiko)

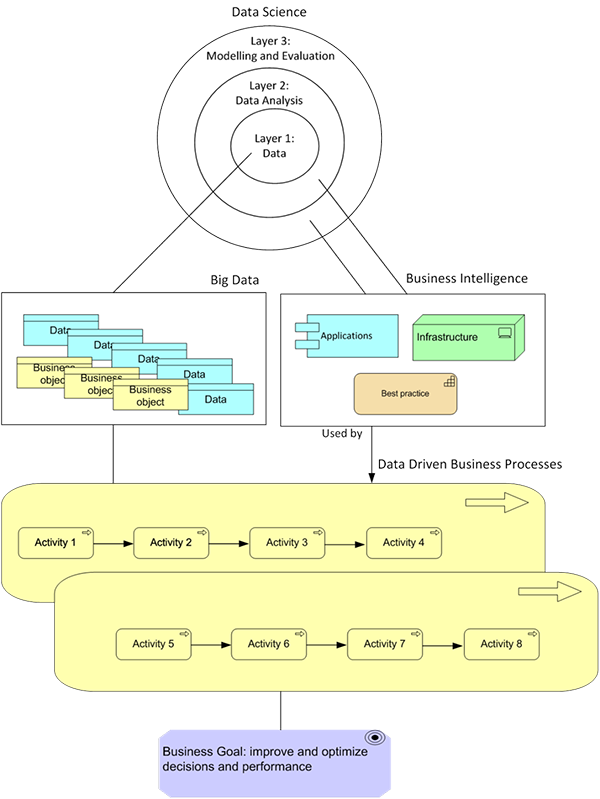
    Data Science can include the elements of the following 3 layers:

    Layer 1 – Data
    Layer 2 – Data Analysis
    Layer 3 – Modeling & Evaluation

  • Business Intelligence – Business intelligence (BI) is an umbrella term that includes the applications, infrastructure and tools, and best practices that enable access to and analysis of information to improve and optimize decisions and performance. (Ref3- Gartner’s definition)
  • Data Driven – It means that the progress in an activity is compelled by data or decision making is driven by specific data points or results.

2. Concept Relationships

Now that we have defined these concepts, let’s look at the relationships between each concept. Below explains how each concept relates to each other.

  • Big Data and Data Science: Layer 1 Data of the Data Science could be Big Data if Data has 3-V characteristics: high volume, high velocity, and high variety.
  • Business Intelligence and Data Science: Business Intelligence is the implementation of Layer 2 and 3 in the concept of Data Science.
  • Data-Driven Processes and Data Science: The Big Data is created by the Business Processes. The Business Intelligence will serve the Business Processes to improve the decision making and performance.
    The diagram below illustrates the relations between the concepts further:

xin 041117 1

3. The Business Analyst and Data Science

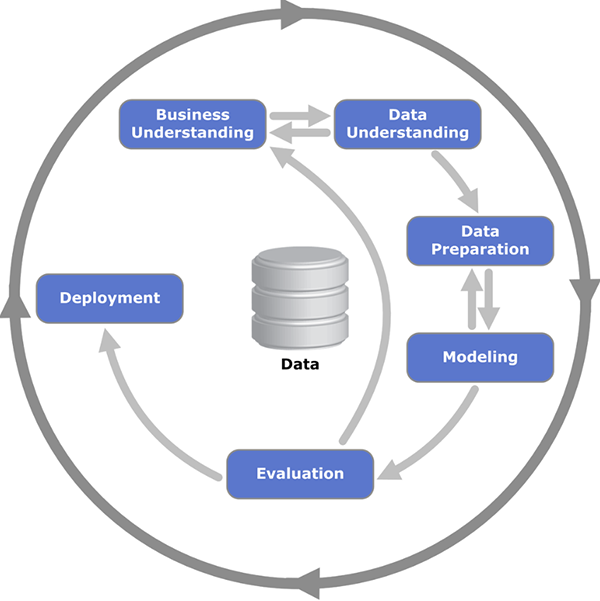
Data Science is intended to create and define the Business Goal and is presented in the most popular CRISP-DM approach (Ref4- Shearer C., The CRISP-DM model shown below).

xin 041117 3

A key part of Strategic Enterprise analysis as outlined in the BABOK (Chapter 6, Page 99) is the creation of a business goal or vision. Business goals and visions are elaborated and defined clearly based on many factors including a data driven approach. Having clear business goals and visions creates a more solid foundation in which programs and projects can be based. Does your project charter contain the data driven results to support the need for the project? A key part of that business case is the data to support the investment.

The first two steps in CRISP-DM requires the good understanding of both Business Process and Data Needs, which is similar to Phase-B and C of the TOGAF circle. Which role can be competent enough for taking care of the first two steps and bridging them seamlessly? I would argue that the Business Analyst is a good candidate for this role as they have the specific skill sets to perform the work of creating specific business goals and visions. In today’s world, the BA typically works just at the project level and rarely gets the opportunity to formulate the business vision and goals. A Business Analyst can then take the vision and goals by using data science to build data sets that support an organization’s vision and goals.

Mckinsey’s report “The age of analytics: competing in a data-driven world” mentions the following “Many organizations focus on the need for data scientists, assuming their presence alone will enable an analytics transformation. But another equally vital role is that of the business translator who serves as the link between analytical talent and practical applications to business questions. In addition to being data-savvy, business’s translators need to have deep organizational knowledge and industry or functional expertise.”

Moreover, the Business Analysts will walk with the “Data Scientists” or any “Business Intelligence Specialists” or “Database Developers” through the whole Data Transformation cycle “Data Collection- Data Preparation/Aggregation – Data Analytics- Deployment.” This team-up is absolutely necessary for ensuring that the deliverable of Data Analytics will meet the Business needs and deliver the associated Business benefits. This is also the Business goal of Data-Driven thing.

Data science can be used at different points:

  • Can be used to create business vision, goals and objectives – creates a need for further Strategic Enterprise analysis or to build a business case for a program or project
  • Can be used to support a project charter or business case – shows the projected value of the project in terms of data, the potential investment needed and the potential Return on Investment.
  • Can be used throughout the project – creates desired state measurements for the project to achieve by further elaborating on data points outlined in the project charter, creates metrics for that can be used to guide the project from initiation to implementation, and finally reports to the project team objectively on how well the project solution design will meet the desired state and business goals.

4. The Data Driven World and TOGAF

TOGAF expresses the Continuous Improvement Concept with a Top-down approach. Data-Driven tries to express the Continuous Improvement with a Bottom-up approach. These two do not have any conflict with each other because Data comes from Business Processes, and the input or output of the Business Processes are in the end presented in the form of Data. TOGAF and Data-Driven approaches meet in the middle.

Such a meeting in the middle can cause a train wreck if both sides are focused on a similar business vision or goals. It’s important to consider the data and its meaning. Two groups can get the same data but draw very different responses. Clear definition of the data points and terms is important to ensure TOGAF and the data-driven world work well with each other.

We can say the Enterprise Architecture is Data Driven. It’s difficult and almost impossible to build the architecture for an organization without at least understanding it’s data. Data Science comes into the picture to fill the gap. Data Science can relate their understanding of business data directly to business vision and goals. Enterprise Architecture needs to understand the business vision and goals clearly to create the environments needed to support the business more effectively.

5. A Fool with a Tool is Still a Fool

Data-Driven does not mean you require a fancy Business Intelligence Tool or vast infrastructure of database warehousing. It means you will need easy access to high-quality data to perform queries, extracts, and analysis. Complex tools may or may not be the answer. Choose your tools carefully to make sure they are meeting your needs.

6. Challenge the Data

Data-Driven means data is challenged. Is this data valid? Is the data of high quality? Should this data be used for decision making? To make a good business decision on data, you must challenge it’s meaning and quality routinely. Don’t take that data set result at face value. Perform data analysis and validate it. When making assumptions, it is important to define those assumptions and communicate assumptions with the data clearly.

Big Data Analytics and Social Media – Are We There Yet?

Having worked in financial services, with insurance companies and a number of software companies, while being very active on social media in my free time, I noticed several interesting trends that I would like to share.

Networking with professionals in Boston and NYC areas and discussing issues facing Big Data Analytics (BDA), it seems the common conclusion is that many companies are talking about BDA, many are claiming they do it, but not many know how to do it. In fact, there are 3 big aspects of BDA:

  1. How to get the data
  2. What to do with it
  3. How to present it

Some companies are very good at collecting big data from a variety of sources and have gigantic databases or data warehouses filled with data, something I saw in the life and disability insurance industry and in the medical trials. But their product management departments have yet have to come up with good ideas for analytical processing of data they have in order to create breakthrough product offerings for the market.

The issue related to it is reporting on big data. I knew a company that had access to many statistical data sources, had developed a robust analytical engine for calculation of risks, and a SaaS product to let client companies to use it over the web, but reporting capabilities were not on par with sophistication of the calculation engine and quality and quantity of data it had. When it tried to invest in industry-standard business intelligence packages, they were not customizable enough for BDA wide range of requirements that their clients had.

Other companies I have seen or spoke to were very instrumental processing data and presenting it, and were looking hard to identify sources in order to get a variety of clean and reliable customer data.

With the rise in popularity of social media (SM) sites, about 1 billion people registered on Facebook, and big crowds using Twitter, Instagram, Pinterest, and a number of ethnic overseas sites, it is not surprising these companies have turned to acquiring data from those sites that offer it for sale.

In the case of Facebook, prior to this year, the users had a choice to opt out of having their personal data collected. Starting on 01/01/2015, the act of logging on to Facebook constitutes the acceptance of new terms for data collection. For most users it would mean that companies could now buy this personal data, information about their location and travels from their smart phones and all of their images posted and hosted on Facebook servers.. It provides companies with a wide variety of information, such as social habits and shopping and personal style preference, and even an option to use profiling of the users. Several companies have developed analytical tools that allow scanning of someone’s Facebook posts and, based on what the user posts, report on his or her personality characteristics.

In conclusion, thecompany that will be able to successfully combine all 3 aspects of BDA – how to get it, what to do with it, and how to present it – and mine social media data to successfully implement a robust BDA solution, will be golden, in my personal opinion.

Don’t forget to leave your comments below.

Agile Business Intelligence

Feature May8 2012  4973821An iterative methodology for fast, flexible and cost-effective Business Intelligence

Can Agile Business Intelligence finally deliver analytics and insights to the people that need it? Or is it potentially a distraction? Agile philosophy has been around for more than a decade, and it looks like BI is catching up to it, with increasing talk of Agile BI. While Agile development emphasizes technology and business teams working side by side, Agile BI puts forth the notion that business end-users should be free of the technologists altogether – with more self-service tools and ability to design interfaces and analytics to explore information without having to first go through the IT department.

Traditional approaches to BI cannot deliver solutions and reporting fast enough in this era of hyper-competitiveness. Companies spend a lot of time modeling data, and that’s precisely what IT team does very well. They collect requirements and transform those requirements into data models. But the problem is it takes too long. By the time the development is done, the requirements have changed. If the IT team didn’t foresee some of the requirements, and didn’t model them, well then, the organization really cannot analyze the condition. So we definitely need environments that run on the data itself, not from data models. Given the difficulty that many organizations have faced in delivering the BI applications their managers and executives need to understand performance and make critical business decisions, it’s not surprising that an alternative development approach is being embraced. Indeed, there is a broad and growing consensus that Agile BI’s time has come.


Some of the key traditional challenges that the Agile BI addresses are as follows

Growing Demand:

Demand for information about business performance has risen dramatically. (The Information Age could just as well be called the BI Age.) BI delivery teams have a large backlog of projects from business users looking for more information to support their decisions. But it’s not just more information users want; it’s more information faster. Agile BI helps IT meet the imperatives for quantity and speed in unlocking the full value of data assets.

Flexibility:

The agile methodology is designed to adjust to changing requirements – and BI requirements change more frequently and profoundly than those for nearly all other types of software projects. In fact, in a 2011 survey of 200 businesses and IT executives conducted by Forrester, 67% of respondents said that BI requirements change at least monthly. A full 20% of respondents said their BI requirements change on a daily basis. Such changes wreak havoc on the traditional waterfall delivery cycle, yet they are inevitable during the lifetime of any BI project.

User Engagement:

The great strength of the agile methodology is that it fosters collaboration between IT and the business. While traditional approaches have struggled to place user needs at the core of the process. Agile BI is all about giving users faster access to functionality and more opportunities to provide feedback. Ultimately, user engagement equates to higher user satisfaction and adoption rates.

Manageable Scope:

Budget overruns and blown schedules can damage IT’s credibility, besides costing the company real money. Because Agile BI focuses on the delivery of smaller sets of functionality in shorter time periods, projects are driven by business defined scope and value. Project timelines and budgets can be tracked in smaller units, and users pay for the value defined. Avoiding scope creep is good news, but it’s better news that these budgets are significantly smaller and the project timelines much shorter.

Lower Costs, Higher Value:

Agile methods in BI have a strong track record in reducing project costs and shortening timelines. Further, because project budgets are aligned to high-priority deliverables and outcomes – that is, high-powered, easy-to-consume applications that users like and that meet real and urgent business needs – overall technology ROI also increases.  Conventional SDLC approaches are poorly suited for BI. Traditional waterfall methodology for SDLC calls for collecting user requirements, documenting them, transforming them into specifications, and then turning specifications over to developers, who then go through the design, build, test, implement cycle. While this approach is often successful for traditional enterprise application implementations, it is almost guaranteed not to work for the majority of BI requirements. The “build it, and they will come” mentality is directly applicable — and recommended — for BI, since only once an end user sees something in front of him, something he can touch and feel and “play with,” will the real requirement materialize.

Clearly a different approach is needed to make BI applications more flexible and able to react much faster to ever-changing business and regulatory requirements. Agile BI is first and foremost a different approach to designing and building BI applications.

The purpose of Agile BI is to: 1) get the development done faster, and 2) react more quickly to changing business requirements. Mostly Agile BI is no different than any agile development methodology that calls for incrementally delivering products versus a big-band approach; for rapid prototypes versus specifications; for reacting versus planning; and for personal interactions with business users versus documentation. The Agile BI methodology differs from other agile approaches in that it requires new and different technologies and architectures for support.

The key to driving an Agile BI project is minimizing project management overhead, reusing existing assets, and automating inefficient manual tasks. Aligning your project budgets to deliverables and outcomes generates more value – that is, high-powered, easy-to-understand, easy-to-consume business intelligence solutions that users like and that meet real business needs.

How to achieve agile development

Agile BI projects should focus on people over process. This does not mean that Agile BI is inherently opposed to thorough and careful development processes, but is guided by a minimalistic business user focused approach, to streamline development cycles. There are three key agile processes that should be adhered to ensure an Agile BI rollout:

Iterative ‘Sprint’ development cycles

  1. Systematize ongoing BI processes
  2. Implement Barely Sufficient Processes

Iterative ‘Sprint’ development cycles

In Agile development methodology, teams work in ‘sprints’ to produce bite-sized deliverables in an iterative manner. Sprints can be one to four weeks long depending on the size and complexity of the project. At the end of each sprint, the business has a working deliverable, such as a new report or dashboard, delivered to them in a production setting.

By contrast, the waterfall development cycle used in traditional BI rollouts, is cemented in a regimented, sequential progression. It is inflexible to changing reporting needs and costly to make changes to. Agile BI, as a process, is about delivering functioning software regularly in short weekly or monthly timeframes – the shorter and more frequent the better (working software is the measure of BI success). Agile BI is about responding to the immediate needs of the BI user, rather than working to establish and deliver ALL potential reporting needs upfront. To establish an approach that facilitates Agile BI, reporting objectives should be readjusted regularly based on available resources and intermediate business goals to help focus attention on what is really important. Working in this manner ensures the relevancy of reporting to business goals and enables a faster, more flexible approach to changing reporting needs.

Systematize ongoing BI Processes

Agile BI development teams must automate any repetitive tasks/processes to allow more time and focus to be spent on developing and delivering end-user features. For example, whilst critical, testing the BI system manually takes up unacceptable resources each and every sprint cycle. Automated testing conducted by the users actually involved in the development of new reports, means that new changes can be quickly tested within the sprint, rather than waiting to be processed by a separate testing team. This way, accountability resides within the team.

Implement Barely Sufficient Processes

Minimizing the amount of ‘ceremony’ associated with BI development reduces the length of development cycles and allows development teams to concentrate on the work that matters. This minimalistic approach does not suggest that careful planning is unnecessary during the development process, but that formal planning and documentation should be aimed at satisfying the practical needs of the project. For example, a concept document for each sprint should focus on business user requirements and nothing more. Additional verbiage simply adds no value. Agile BI is just as much about maximizing the amount of work not done.

Summary

Successful Agile BI deployments enhance organizational flexibility and responsiveness. Increasingly, businesses and their personnel are exploiting the benefits of Agile BI, allowing them to respond with immediacy to business demands. To survive and prosper in a competitive marketplace, businesses from all industries and sectors have to be able to scan their external environment, review their internal processes and make appropriate proactive and reactive changes. Modern companies are striving to spread fact-based decision-making throughout their organizations. Agile BI solutions, with their end-user centric approach, enable organizations’ to anticipate and adapt to shifting market conditions.

References

  • Information Management Blog : Agile BI
  • Yellowfin : Agile Business Intelligence
  • Forrester report on Agile BI Out Of The Box
  • Balanced Insight: Enabling Agile Business Intelligence with Balanced Insight

 Don’t forget to leave your comments below.

Preventing Disasters; How to Use Data to Your Advantage

The late Lew Platt, former CEO at Hewlett-Packard once stated, “If only HP knew what HP knows, we would be three times more productive.” This is a typical situation in large organizations, where far too often, disasters arise from lack of awareness. Critical information is available in the organization, but goes undetected, is not communicated or is blatantly ignored.

Take the recent mortgage meltdown, for instance. The banking industry has a wealth of data on consumers, robust credit risk models, as well as lessons learned from the past. Their analytics told them which loans were too risky according to traditional models. Yet, they decided to relax their standards, ignore the data…and the rest is history. Or, take the recent PR debacle around Southwest Airlines’ plane inspections. The FAA had inspection logs that could have told them that the planes were passing with flying colors at unprecedented rates, yet no one suggested conducting a site visit to see if the airline was actually performing those inspections. And when low-level employees reported issues to their managers, that information was not passed on. Fortunately, in that case, a tragedy was avoided.

If there is a question we should be asking in the current economic and regulatory environment, it is “Why does accountability so often fail, and what role does analytics play in preventing these disasters?” Organizations need to understand why they fail to detect early warning signs, how to filter and monitor available data to create actionable information, and how correctly applying analytics can turn data into knowledge. That knowledge can then prevent disasters and increase competitive advantage.

Why Accountability Fails

The repeated disasters that occur due mainly to failures in accountability arise for the following reasons:

  • Large, complex organizations (or environments) make it difficult to know what is happening “on the ground” and detect significant changes in the environment.
  • Very often, players in the organization (managers, employees, others) receive incentives only for presenting a positive picture and anchor on how things have worked in the past.
  • Organizations measure and monitor only past-focused, outcome measures, which only indicate a disaster once it has already occurred.
  • Many organizations lack the skills necessary to manage data, much less apply analytical techniques to make sense of that data and keep an accurate view of the current operating reality.

The Impact of Anonymity

The lack of awareness that often brings disaster stems from the anonymity that characterizes today’s organizations. A hundred years ago, most business transactions were conducted face to face. Business owners walked the shop floor. Customers who bought eggs from the village shopkeeper knew not only the shopkeeper, but also the farmer who raised the chickens. Loans where made to people the banker knew personally and regulations were made and enforced by local officials.

The more complex an organization becomes, the less transparency there is, and the more difficult it becomes to make good decisions. Consumers and producers don’t know one another. Decision makers and implementers don’t have direct lines of communication. By the time information reaches a decision-maker at the top, it is usually highly filtered, and often inaccurate. The information and implications have been spun so as not to upset management or cast dispersion on employees, and therefore fail to present the reality of the situation.

These conditions not only impair the organization’s ability to understand what is currently going on, but also remove any ability to detect change in the environment. Outside information can effectively be closed out in extreme examples. The U.S. automakers in the 1970s, who looked out the executive suite window into their parking lot and saw only U.S.-made cars, determined that Japan was not a threat. Meanwhile, dealers in California had significant early signals in their sales numbers that Japan was indeed a threat to the U.S. auto industry.

Incentives for Bad Behavior

An even more insidious problem is that disasters often arise because organizations have actually encouraged behaviors that lead to them. The filtering of information cited above is actually a very mild form of this. Employees and managers are rewarded for highlighting what they’ve done well, so why would they ever identify something that is going wrong on their watch?

We tend to blame those who bring bad news, whether they deserve it or not. Consider any major whistle-blower of the past. The amount of scrutiny, negative media attention and damage to their career is enough to dissuade most people from taking a stance. And yet those same people brought to light, and often prevented, significant disasters in the making.

So many organizations reward those who bring in good short-term results, prove out the organization’s current business model and don’t ruffle too many feathers. In return, we get exotic financial instruments in an attempt to make quarterly revenue, low standards on food or workplace safety and fudging on project and financial status reports. The contrarian voices pointing out the impending disaster go unheard and unheeded, and changes come too late to matter.

Driving While Watching the Rear View Mirror

The vast majority of the data that organizations look at represent outcomes that are past-focused. The traditional financial statements show the outcomes of business activities (revenues, expenses, assets, liabilities, etc.) while nothing in those statements measures the underlying activity that produces those outcomes. Hence, nothing gives any indication of the current health of the organization.

Kaplan and Norton sought to remedy this with their Balanced Score Card approach. By focusing on the drivers of those outcomes, the organization should be able to monitor leading indicators to ensure the continued health of the enterprise. Relatively few organizations have fully adopted such an approach, and even those few have struggled to implement it fully. Too often, managers do not fully understand how to impact the metrics on the scorecard. And as time moves on, the scorecard can fail to keep up with changing realities, suggesting relationships between activity and outcome that no longer exist.

Numeracy?

“Numeracy” is the ability to reason with numbers. John Allen Paulos, Professor of Mathematics at Temple University, made this concept famous with his book Innumeracy, in which he bemoans how little skill our society has in dealing with mathematics, given how dependent upon it we have become. Organizations today struggle to maintain a workforce that has the skills to manage the data their operations generate. Once the data have been wrangled, the analytical reasoning skills required to make sense of that data are lacking.

Analytics provides powerful tools for dealing with massive quantities of data, and more importantly, for understanding how important relationships in our operating environment may be changing. But without a strongly numerate workforce, organizations cannot apply these techniques on their own and have a very limited ability to interpret the output of such techniques. A lack of good intuition and reasoning with numbers means that many warning signals go undetected.

What Drives Organizational Outcomes?

Organizations that want to prevent disasters and increase competitive advantage first need to define what constitutes critical information – in other words, what really matters to the organization. Prior assumptions have no place in that determination. Let’s say, for example, a company is proposing to increase its customer repeat rate by increasing satisfaction with its service. But does that relationship between customer repeat rate and satisfaction with the service really exist? And to what degree? Amazon.com, for example, does not simply assume that a person who buys a popular fiction book will want to see a list of other popular fiction books. Rather, it analyzes customer behavior. Thus, someone who is ordering Eat, Pray, Love might see an Italian cookbook, a Yoga DVD and a travel guide for Bali as recommendations because other people who bought that fiction book also bought those other items.

The steps to decide what matters are:

  1. Decide what the organization wants to accomplish.
  2. Identify the activities (customer behaviors and management techniques) that appear to produce that outcome.
  3. Test and retest those relationships, collecting data from operations to measure the link between activity and outcome.

Once an organization has identified what constitutes its key activities, how can it find the information it needs to monitor them?

Find the points in the value chain where the key actions have to occur to deliver the intended outcomes.

  1. Collect critical information at, or as close to, those points as possible. The closer an organization can get to the key points of value delivery, the more accurate the information it can collect.
  2. Continuously look for the most direct and unfiltered route to obtain the richest, most consistent information on each key point of the value chain.
  3. Keep testing each assumption by asking the question, “What surprising event could I see early enough to take corrective action?”

Stop Trying to Prove Yourself Right

Several traditional ways of doing business blind organizations to warning signs of potential disasters. First among these is looking for data that confirms that all is well. Although extremely counterintuitive, it is critical to look for evidence that things are not all right. Ask the question, “if something were going to cause failure, what would it be and how can it be measured?” If it can be measured, then it can be corrected early and failure can be avoided. Rather than indicating what has gone right in the past, these measures contain warnings of what could go wrong in the future.

To see the early warning signs, follow this process:

  1. Ask what assumptions are being made in the process of executing strategy to deliver value. For example, if the goal is to increase the efficiency of inspections, is there an assumption that inspectors will become more efficient while still adhering to the same high quality standards? Or, in a call center, is there an assumption that reps can decrease call handle time and still provide superior service?
  2. These assumptions are alert points where failure might occur. Don’t wait for the final outcome, but track, measure and monitor each assumption to make sure it is playing out successfully. This process is well known to project managers. They don’t just design Work Breakdown Structures and Critical Paths and then wait around for the end date to see if the project was successful. As soon as a task begins to exceed its scope, the impact is assessed all the way down the line.
  3. Keep testing each assumption by asking the question, “What surprising event could I see early enough to take corrective action?”

Organizations that do this well are not operating with a negative, doom-and-gloom perspective. Rather, they want their positive outcomes so badly that they look for data that might be telling them something is going wrong so they can correct it before it is too late. They are willing to “Fail Fast” and “Fail Forward,” keeping the failure small to ensure large successes.

People Power the Process

Creating knowledge from data to prevent disasters depends on both technology and human skill. Computers are powerful tools that can help collect, store, aggregate, summarize and process data, but the human brain is needed to analyze the data and turn it into actionable information. It’s this human factor where the biggest gap exists in most organizations. Finding people who can perform the required analysis is becoming increasingly difficult. A spreadsheet is just a pile of data until someone applies critical thinking, adding subjective experience and industry knowledge to derive insights into what the numbers really mean.

Organizations must invest in developing these skills in their workforce. Here’s how:

  1. Provide employees with the training, job assignment, education and mentoring opportunities needed to develop their analytical skills, industry expertise and decision-making acumen.
  2. Subject decision-making to evidence-based approaches, providing feedback to improve future decisions.
  3. Ensure employees have the tools they need to manage the volumes of data they are expected to digest and act upon.

Blame Is Not an Option

In his book The Fifth Discipline, Peter Senge said that a “learning organization” depends on a blame-free culture. In other words, when a problem arises, people need to refocus from laying blame or escaping blame and start fixing the problem.

In today’s data-rich world, preventing disasters large and small requires monitoring and filtering through the large volumes of information that stream into organizations every day to find early warning signs of imminent failure. Intellectually, just about everyone will agree that it makes sense to look for what could go wrong. Emotionally, however, it’s another matter. It is both counterintuitive and intimidating to ask managers to search out constantly how the organization is failing. Establishing a blame-free culture is the final frontier to create a new awareness and encourage people to test assumptions, make better use of analytics and communicate information without fear.


Charles Caldwell is Practice Lead, Analytics, with Management Concepts. Headquartered in Vienna, VA, and founded in 1973, Management Concepts is a global provider of training, consulting and publications in leadership and management development. For further information, visit www.managementconcepts.com or call 703 790-9595.