Author: Karen Schemmel

Ode to a Picture

Practically everyone has heard the expression “a picture paints a thousand words”.  In the world of art, a picture can be used to express ideas and evoke emotions, or it can also simply be used to capture on canvas something or someone significant. In the professional world, carpenters and architects rely on drawings to build to precise specifications. In the business analysis world, the whole purpose of creating a picture, otherwise known as a diagram, is to clearly communicate information without using words.

There are many different types of diagrams at our disposal, and I will attempt to name a few key ones here: entity, activity, data flow, sequence, use case, flowchart, system context, workflow, object, component, and UML.  However, the focus here is on what you want to convey to your audience through a diagram and the benefits of doing so, rather than how or which diagram you should use to do so. The point is to emphasize the benefits in the use of diagramming in many situations to communicate meaningful information and transform your business analysis efforts!


What a Diagram Can do for You

Diagrams can tell a story from numerous perspectives. For example, they can be used to confirm our understanding of processes, or to define system interfaces. They can illustrate system and network connectivity. They can help to explain complex processes. Diagrams can depict workflow, business processes and system interactions. They can help to define in scope and out of scope features.  They can also help establish or confirm understanding between the business analyst and a stakeholder in a way that verbal or written words sometimes cannot.

Diagrams can help confirm requirements by illustrating what needs to happen in a system or workflow. They can also be used to model database structures and to depict data flow. Diagrams can cut across confusing jargon or long-winded verbal or written explanations and get right to the point in the simplest of terms. When you consider all of the benefits, the power of a diagram is undeniable!


Diagrams are Blueprints to the Past, Present and Future

Diagrams can be used as blueprints for past, current or future conditions. For instance, diagrams from the past can help explain why outdated processes or procedures might have come into existence. How many times have you come across the question “why do we do this”? The typical answer of “because we’ve always done it this way” never solves the problem.

If only you could time travel back in time to document a process using a diagram so that in the current day you or anyone else could easily answer any questions about the “why’s” of a process or procedure. Prevent this lapse of information for future questions and diagram your process!


Take Time to be in the Present

Although your stakeholders (and you) might be very familiar with the tasks and workflow used with a given process, it is still beneficial to take the time to depict current “as-is” diagrams.   These diagrams are helpful to illustrate current interactions between actors and systems as well as point out manual tasks that might be targets for process or system improvements. Current state/as-is diagrams can also serve as a valuable documentation tool. New employees and auditors alike tend to appreciate the information conveyed in a diagram.

Additionally, going through the process of building out diagrams for current business systems and stakeholder processes can help demonstrate the need for better written procedures. Current state diagrams can also help point to key performance indicators when changes are proposed. For instance, when comparing the proposed future state to the current state, time-consuming manual tasks will hopefully be earmarked for potential elimination. Having these diagrams at your fingertips can make these improvement opportunities stand out, which will make the task of quantifying the time saved or cost savings (or whatever differences) that much easier to document.


Advertisement


Illuminate the Future

Future state or “to-be” diagrams can help to illuminate the roadmap for upcoming changes, whether that might be a business process, a system component, or a new business system altogether. For instance, they can help define system changes and plan improvements to technical interfaces, thereby avoiding future outages. They can help to confirm our understanding of impending changes to processes and to thereby plan accordingly. They can also help identify the business processes that may become obsolete. Future state diagrams can also help the organization stay focused on the planned and specified changes or help to inform decisions to adjust the plan if necessary.


Conclusion

As a business analyst, the diagram has to be one of the strongest tools in the arsenal of BA weapons. There are so many uses and applications where a diagram can transform work efforts. It doesn’t have to be fancy or complex. In fact, the simpler the better. The point is to use a diagram to convey the desired information in as clearly a manner as possible. The benefits of a diagram can be felt across all levels of the organization, communicating across different levels of knowledge and understanding. Diagrams can clarify information for stakeholders and business analysts alike.

They can validate or improve existing understanding and inform future changes. They can serve as documentation for auditors, and training tools for staff. Diagrams can highlight the need for improvements and underline performance improvement indicators.

The uses and benefits go on and on, so hopefully this will inspire you to take a little time in each of your project efforts to paint the picture that will prevail in communicating your message and save yourself a thousand words!

Better, Not Bigger!

After working as an IT Analyst in the same organization for over twenty years, it became apparent to me that every year our project load got bigger and bigger.

Just when you thought that someone was going to stop the madness, every new year we ended up out-pacing the previous year’s project load. It wasn’t just the shiny, new initiatives coming on the scene. There was a cumulative effect when a few of the previous year’s projects would spill over, creating a nice overlap effect. Unanticipated architecture changes halted project progress and impacted deadlines. The end-result was an overwhelming dog pile of projects that over-consumed resources and frustrated many.

Year after year, it was like Ground Hogs day, where we relived the same vicious cycle. While strategic planning did occur, strategic project selection was based on which got the most votes by upper management. Most of the time IT resources did not see project requirements until projects were launched.

Moreover, strategic projects did not include system or application upgrades, those of which consumed large portions of IT resources.

The trouble for me was that I knew there were better ways to manage the project capacity load, and thus avoid the relentless chaos. The ways to achieve more was not to add more on to the plate! After spending the past five years learning Business Analysis tasks and techniques, I knew there were recipes and ingredients for counteracting and avoiding the various problems we faced.

Imagine that the organization described above chose to hire a Business Analyst to help address the project chaos. With the skills and discipline that a Business Analyst can provide, this company could have transformed their chaotic project life-cycle into a well-oiled machine. With a revamping of their project processes, this company should be able to better focus on the priority strategic initiatives that provide the most value, rather than spreading itself thin with the vast number of projects. In fact, with proper capacity planning, they might possess a greater ability or agility to act on opportunities, such as offering new products or services faster than their competitors. Furthermore, they may even open up a new window to engaging in process improvements for their operational functions.

You might be wondering how this amazing transformation would take place. What specific tasks and techniques would this Business Analyst use to effect such dramatic change in this company? I contend that the most dramatic changes would come from starting at the beginning in the initiation and planning phases.


Advertisement

During the initiation phase, our talented BA could follow a predictive approach and use the following techniques to minimize uncertainty and mitigate “surprise” architecture changes, as well as better identification of resources needed:

  • Business Case – this should be used to outline the justification for pursuing the project, as well as the value it will provide. The Business Case illustrates the value a problem or opportunity will bring if realized. The Business Case would also outline constraints (i.e., need to install security equipment, upgrade servers, etc.) before setting the schedule!
  • Enterprise Analysis – this would compare the current state of the environment to the desired future state, thereby illustrating the gaps.
  • Requirements Analysis – this will outline the specific needs, and specific technology needed for the solution design. This process will also uncover any non-functional requirements needed, and then ultimately whether the proposed solution would meet the needs. To provide the benefit of proper capacity planning, capture this information in the analysis and design phase of the project rather than at kickoff!
  • Functional Decomposition –If the project scope was broken down into smaller pieces for analysis, then project resource and timeline uncertainties could be greatly reduced.
  • Estimation – With the requirements analyzed, a far better estimate of the amount of effort and needed resources for the project will be much accurate.
  • Prioritization – by identifying the value (or ROI), the complexity, and risks of each project, we could then assign a customized rank to each one. This ranking should guide the company in determining which projects to pursue in the appropriate order.
  • Stakeholder Analysis – by outlining who might be impacted by the solution or the implementation of the solution, this will guide in resource capacity planning.
  • Backlog Prioritization and Management – by regularly reviewing the entire backlog of projects to determine if priorities or needs have changed would be essential in keeping the company focused on those projects that bring the most value to them.

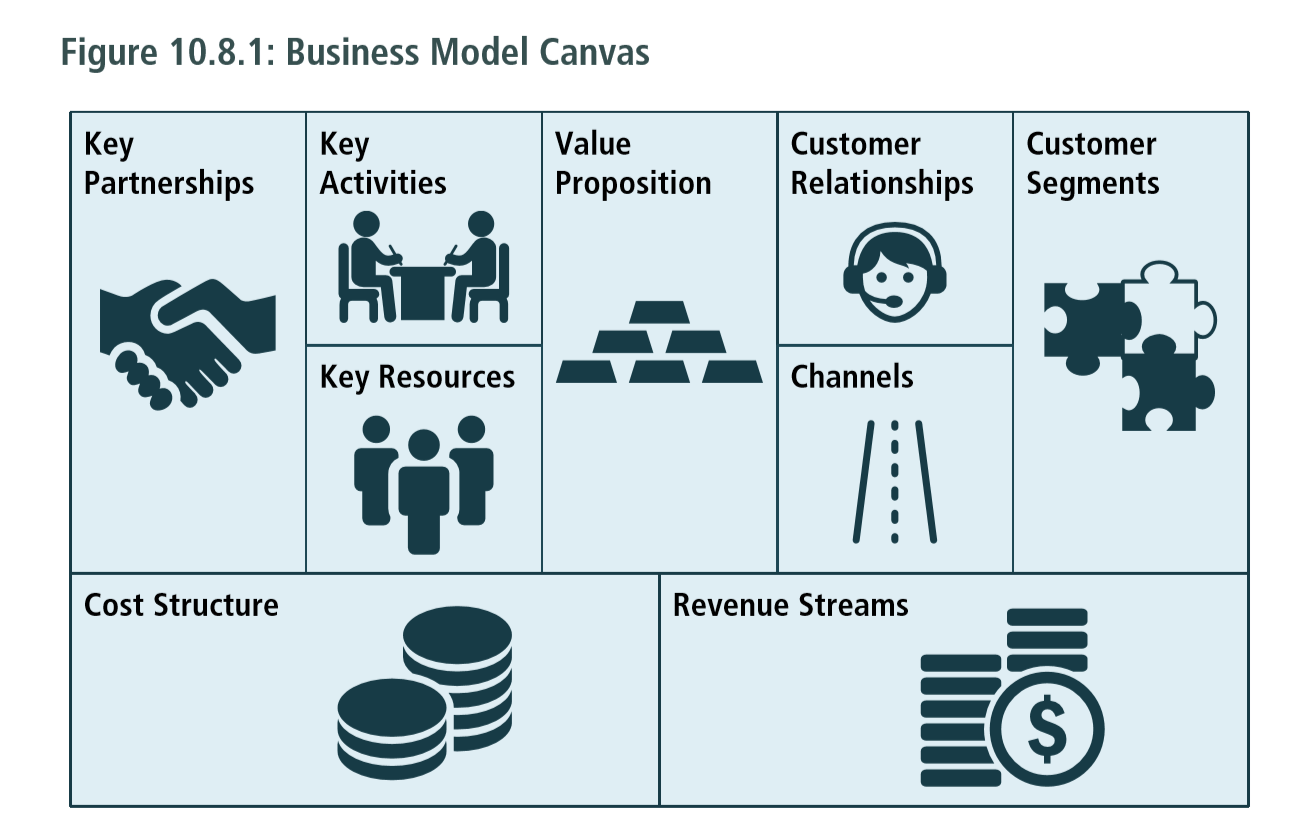
There is one final tool that I am certain would have revolutionized the company’s formulation and prioritization of goals and strategies: a Business Model Canvas.

TABLE A- BABOK V3 – BUSINESS MODEL CANVAS

schemmel 070617 1

Table B – BABOK V3 – BUSINESS MODEL CANVAS DEFINITION

“A Business Model Canvas can be used as a diagnostic and planning tool regarding strategy and initiatives. As a diagnostic tool, the various elements of the canvas are used as a lens into the current state of the business, especially with regards to the relative amount of energy, time, and resources the organization is currently investing in various areas. As a planning and monitoring tool, the canvas can be used as a guideline and framework for understanding interdependencies and priorities among groups and initiatives.

Business model canvas allows for the mapping of programs, projects, and other initiatives (such as recruitment or talent retention) to the strategy of the enterprise. In this capacity, the business model canvas can be used to view where the enterprise is investing, where a particular initiative sits, and any related initiatives.

A business model canvas can be used to demonstrate where the efforts of various departments and workgroups fit and online to the overall strategy of the enterprise.”

  • IIBA BABOK Version 3.0

In closing, after enduring years of frustration over the overwhelming burdens, it finally occurred to me that I was not a good fit for this style of operating. Luckily for me, I was recently able to find the perfect new job leading the newly formed Business Analysis department! To be in a position to guide others in using the techniques and framework that the practice of Business Analysis provides is like making it over to the other side of the rainbow! I can’t wait to work on my new organization’s transformation!

References/Bibliography
BABOK V3, A Guide to the Business Analysis Body of Knowledge. International Institute of Business Analysis.