
Tag: Methodologies

Being Agile

In the past 20 years, I have seen our ITS department develop systems that were never used.

Maybe the stakeholder opened it once, tried it, said, “Nope,” and it just went to the annals of forgotten systems. The developers thought they knew what the users wanted – turns out, they sometimes didn’t.

I have also seen systems rejected when first developed then after a learning period users claimed they could not live without. These were our success stories! However, whether a project would be a success or not was often up in the air and never predetermined.

Three business analyst positions in 2015 were created to try to avoid the first scenario. We had little idea of what we were doing. I came from a tech support/teaching background while my two cohorts came from a developer background. One thing our leaders all agreed on was that we were “people” people.

We went to a few classes, took a few webinars, and googled a lot. We quickly learned that while these activities could help us build our business analysis foundation, there was no class or series of classes targeted at our education needs. Our higher education organization focus was on a medical school and health science center.

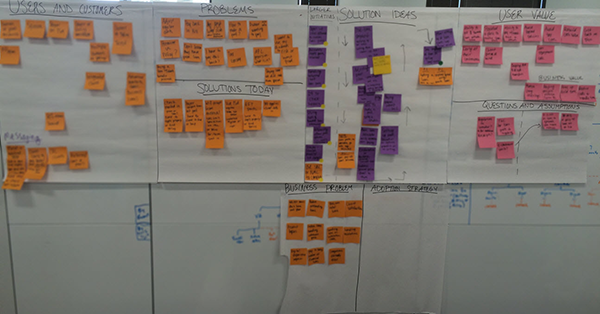
So, we dove in head first and started figuring things out ourselves. We learned how to schedule a meeting of a large group of people, many who were not yet vested in the project. We learned how to stop talking and start listening. We spent countless hours trying to get to the very essence of what users wanted in a system. We learned how to draw up a SIPOC, create process maps, and document user requirements. We even fought an internal battle against developers who questioned aloud whether our existence was necessary. Fortunately, our executive director assured us we were instrumental in helping solve the campus’ computing issues.

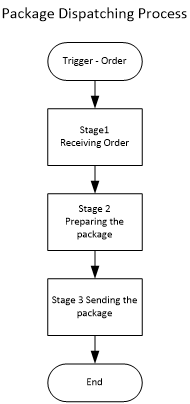
We decided to use the waterfall methodology. Conception, initiation, analysis, design, construction, testing, production/implementation, and maintenance – ah, sweet maintenance – was the path for us. We now felt armed with a plan for projects. No more time wasted delivering useless systems that weren’t well thought out.

We noticed our most successful project was different. We met weekly with several users, got their thoughts, and the developer, who attended the meetings, went back and update the system with their requests. After only a few months of this, we delivered a system that cut our users process time from two weeks to two hours.

I thought the success of this project was based on customer engagement and in part, it was. However, we soon realized it was our different approach to this project that sped it along. We cut away a lot of the fat and got to the meat of the problem.

After other projects had begun to drag on, we realized we had pages and pages of user requirements and process maps, but the amount of time we were taking to gather all this caused customer interest to waning. We also weren’t sure if all this paperwork we had contained anything of substance to turn over to the developers.

Our team lead suggested the agile methodology. Remembering that highly success project, I realized that, even though I did not realize it at the time, that was agile and I was on board.

Switching was not without its own pain. I had spent an enormous amount of time on a project using the waterfall methodology – the user requirements were complete and signed. “I am done,” I thought. Then the team lead wanted me to get user stories.

Something strange happened. I drew up user stories (since we had been meeting for so long, I felt I knew what they wanted exactly), but when we met with the users, a new idea came out. Things I thought I knew for sure were scrapped.

While it took a year of meetings to get the user requirements hashed out, the user stories only took three meetings. I turned them over to the team lead, and he was pleased with the results. I began to see the light at the end of the tunnel.

We are still new to Agile, and I am sure we are going to make mistakes. However, we continue to learn and grow from our mistakes and the more we do that, the more tools we will have to help our users meet their end goals.

At the end of the day, that is all we need.

Top 5 Techniques in Business Analysis

Having been involved in several Business Analysis engagements and assignments, I have discovered top 5 techniques that I find most useful for Business Analysis, and they are highlighted below.

One Caveat: I am more tilted towards Strategic Business Analysis.

1. SWOT Analysis

The SWOT Analysis, which stands for Strength, Weakness, Opportunities, and Threat is a very simple, yet powerful technique used by Business Analysts to analyze both internal and external organizations under analysis.

When using SWOT Analysis, the Business Analyst conducts, and thorough analysis of the internal (Strength and Weakness) and external (Threats and Opportunities) actors and factors at play in the space the organization operates in.

In using SWOT Analysis, the Business Analysis answers the following questions under each of the quadrants

  • Strengths: characteristics of the business or project that give it an advantage over others
  • Weaknesses: characteristics of the business that place the business or project at a disadvantage in relation to competitors or other projects
  • Opportunities: elements in the environment that the business or project could exploit to its advantage
  • Threats: elements in the environment that could cause trouble for the business or project

Use: The SWOT Analysis is useful in understanding the position of the organization and helps to recommend the capabilities the organization needs to build or the feasibility of any initiative based on the result of the analysis.

2. MOST ANALYSIS

The MOST Analysis is a very simple and extremely powerful framework tool used by Business Analysts for analyzing and planning the details of what an organization does and initiatives the organization should be looking at doing and helps maintain strategic alignment. It can also be used to give the business or organization a fresh sense of purpose and capability.

The M.O.S.T. Analysis is a highly-structured method for providing targets to team members at every level of an organization. Working from the top down, it ensures that you retain focus on the goals which matter most to your organization

The MOST Analysis comprises of four elements:

Mission: Mission is the top-level, overall reason for being in business and defines outcomes the organization wants to accomplish. The more specific the business is when defining the mission, then the more success the business will have later on trying to define the remaining points within the tool.

Objective: The objectives are one step down from the mission. Think of these as a collection of individual goals that will add up to reaching the overall mission. Just like with the mission, objectives should be specific enough to guide decision making and planning for the future. With the mission in place, it should be relatively easy to develop a list of a few objectives. Objectives should be Specific, Measurable, Achievable, Realistic, and Timely (S.M.A.R.T.). Otherwise, goal-creep will set in, and objectives will become fuzzy and difficult to implement.

Strategy: These are the things the organization or business will do to reach the objectives. What actions should be taken to accomplish the objectives, and in turn, the mission? Strategies offer a way to quickly review and group the tactics implemented on the ground floor, so they make sense as methods to achieve your objectives

Tactics: Tactics are the methods you will use to carry out your strategies. They should be simple and relatively discrete processes that can easily be understood and carried out even by people who do not have a high-level overview of the M.O.S.T. analysis.

Use: The MOST Analysis is used to ensure the BA recommends the solutions that the organization needs to meet its objectives and mission. It is also used for alignment.

3. PESTLE ANALYSIS

The awareness of the influence the environment has on the organization the Business Analyst is working with is a very important factor in any Business Analysis engagement. The PESTLE Analysis, which is also called PEST Analysis is a tool used to identify and analyze the key drivers of change in the strategic or business environment. The analysis looks at the drivers and factors in the following and how the happening in those areas influence the decisions and the type of recommendation the Business Analysts gives the organization

Political: What are the current happenings and factors in the political landscape of the environment the business operates and how can it affect or change our business.

Economic: What are the important economic factors such as inflation or meltdown is happening, has happened, or will happen in our business environment and what do they mean to our business

Social (or Socio-cultural): What cultural aspects are most important that we need to pay attention to

Technological: What are the trends and innovation in the technology space. What is the direction technology is going, and what impact will they have in our organization or business?

Legal: What are the regulations or legislations that directly impact our industry or environment and how do they affect our business

Environmental: What are the environmental considerations we need to make in our business and organization.

Use: The PESTLE Analysis is used to understand the factors and drivers within the environment the organization operates and how those factors will influence the narratives of the organization

4. BRAINSTORMING

Brainstorming in a group creativity technique that is used extensively by Business Analysts to generate ideas, identify root causes of problems, and solve complex business problems. Most of the other techniques such as Mind Mapping, Root Cause Analysis, SWOT, and PESTLE Analysis use Brainstorming and an underlying technique.

I particularly find this technique very useful in generating diverse ideas.

Use: This is used in problem-solving, fact finding and idea generation

5. MINDMAPPING

You want to be sure you have all the areas within the analysis covered, you want to certainly confirm you have considered the different and diverse components and elements under analysis, you do not want to miss anything out? Then you would need the MINDMAP technique.

The Business Analysis function has over the years been greatly helped by this special and often unrecognized technique, but I find it extremely helpful during my business analysis engagement

What are the techniques you find useful in Business Analysis engagement? Share in the comment sections

The Business Analyst of Tomorrow

Business Analysts of today – we are no longer the hired help of years gone by. Handing over Business requirements to IT to interpret and build and then moving onto the next project.

Business Analysts are no longer the bottom of the rung on the ladder or passive contributors who follow orders. Business Analysts are not arbitrarily adjusting scope, timescales, and budgets from week to week.

Business Analysts and Business Analysis now have a growing voice – but more than that, we are finally being heard.

Business Analysts is now our time to make a real impact in the world. To take advantage of the now and ensure the role of BA of Tomorrow (BAoT) is flexible and in-tune with what our Business, Customers and Technology partners want and need.

Why Now? How Did We Get Here?

We have adapted. We had to! We have gradually, painstakingly moved from the periphery into the center of our Business and Customer worlds. Our jobs dictate that we are experts in people, process, and technology. We have created a space in this new world by collaborating, iterating and staying relevant.

We are driven by the wants of our customers, the needs of our Business and through data and evidence-based attitude that makes us increasingly hard to ignore.

We Empathetically Understand Customers

Business traditionally interacted with customers only to understand and gauge a particular market or segment for a product launch or other Marketing purposes. Business Analysts historically never got to speak to real customers which made our jobs difficult. Things are changing. A design-centric view of the world – which is riddled with ambiguity and empathy – is the realm in which the BAoT starts adding value. Removing age-old stigmas, notions, and perceptions like:

  • ‘The business already knows what the customer wants, so why would we need to speak to customers?’
  • ‘The solution was already determined, so do not challenge it!’
  • ‘We cannot showcase that to a customer. It is not ready!’
  • ‘Well our competitor is doing it, so we must do it as well, they probably know more than us!’

Business Analysts have been integral in shifting these perceptions and expectations. Business Analysts have a proven value in talking to customers to elicit fantastic insights and hard evidence to back up good business solutions. The evidence is the key here. Business Analysts have played a huge part in changing the mindset of our business partners to accept the compelling evidence for creating the hypothesis to solve real business problems (1). Compelling evidence is drawn from ethnographic (2) studies which gather insights to real life problems are further proof the BAoT uses empathic thinking to solve the right problems at the right time for the right customers.

We Speak the Language of Technology

Traditionally this is where BA’s have excelled. Being required to act as a conduit between the Business and IT ensured we kept our skin in the game – albeit at a functional level. The new Business Analyst has to be even more conversant in the languages of our technologists. Defining the ‘what’ – simply extrapolating a business requirement into a functional specification to be consumed by a ‘techie’ – is no longer the sole role of the BA. We need to ensure that directionally, a project, program, portfolio, or strategic direction of a Business starts with the correct approach for the team, solution, technology and business. Being able to direct ‘how’ work is done (as well as ‘what’ work needs to be done) is critical to the success of the Business, and we play an important role in kicking off and guiding this work.

We Care About Results

The core competencies of fail fast-learn faster, agility, lean, customer centricity is the ‘action’ to our ‘thinking.’ Prototyping, testing, and measuring (think, make, and check) ensures our solutions address real problems and we can make decisions quicker by continuously learning. We bring everyone together to solve problems then quickly validate the ideas with customers, so time and money are not wasted.

Business craves results. The dynamic Agile world that demands business agility is here to stay. The Agile manifesto initially was a set of simple principles, but it has changed the way we all look at and perform work. It is not a fad, and the BAoT needs to ensure they take everyone on the journey to realization with them. Evangelism through pragmatism and espousing common sense to those uninitiated in Agile, CCD/Design Thinking is where real breakthroughs will be made.

The BAoT ensures the Business’ bottom line, goals, the things the Business determines to be critical to success are kept front and center at all times. We will ensure the problems and opportunities identified are real and that the solutions to these problems can be achieved and measured. We work to understand what success looks like and how we best achieve those results. Critically we measure that success so that we can learn how we can refine and improve.

BA’s Unite

Business Analysts act as the fulcrum between technology, the business, and the customer. We design solutions which solve genuine customer and business problems. We ensure the voice of everyone is heard. We make sure we are doing the right thing at the right time. We ensure the biggest value add is understood, delivered and measured. The role has finally got a voice at the table. We have moved on from being passive bystanders to vocal advocates of the Customer to activists of success for our Business to campaigners of critical thinking. We offer real value in this ever-changing world. Business Analysts now is our time!

Editor Notes

(1) Scientific Method is a systematic and ordered approach to the gathering data and solving problems. The basic approach is the statement of the problem which is then followed by a statement of the hypothesis. A hypothesis is a statement which attempts to solve the statement of the problem. Experiments are created to test the hypothesis. Experiments will either confirm or negate the hypothesis. The results of the experiment are observed, and conclusions are drawn from observed results. The conclusions may tend to uphold or to refute the hypothesis. Results of experiments may also find the statement of the problem as invalid or in need of modification.

(2) Ethnography is the systematic study of people and cultures. It is designed to explore cultural phenomena where the researcher observes society from the point of view of the subject of the study. BABOK refers to a similar technique called Observation. Observation is also known as “Gemba” (meaning respectful observation) and is a Six Sigma technique.

All you need to know about the Process Performance Metrics

After defining a new Business Process, how can we measure if the daily work is performed as the process definition?

Then we need Performance Metrics or Performance Indicators. The purpose of measuring Performance Metrics is to control whether the Process is executed successfully and meet the goal of the process. If the Business Process Performance is not good, a follow-up gap analysis can be performed for improvement.

Which Performance Characteristics are meaningful to measure?

A Process is aimed at achieving a goal or purpose. Therefore the Performance Metrics will be all about the achievement of the Process’s goal or purpose. There are several classical Performance Characteristics:

Effectiveness – it indicates whether the goal of the Process has been achieved .

Efficiency – it indicates whether the purpose of the Process has been achieved with the minimum resource (time, money).

Quality – it indicates whether the purpose of the Process has been achieved by meeting the quality criteria.

Timeliness – it indicates whether the purpose of the Process has been achieved in time.

Next to these, some industry-related characteristics can be used. For example, for the Offshore Engineering industry, Safety is an essential core value. So there must be a Performance Metric reflecting the Safety characteristic.

What are the basic attributes for a Process Performance Metric?

In order to define a Performance Metric structurally and consistently, let us first define the basic attributes which a Process Performance Metric should have:

  • ID
  • Name
  • Definition
  • Performance Characteristic
  • Measurement Method
  • Input for the Metric Measurement
  • Output Registration
  • Acceptance Value Criteria
  • Target Value

How to define the Performance Metric for a Business Process?

The definition of a Business Process normally consists of the following elements:

  • the goal of the Process
  • sequential Stages and the purpose of each Stage
  • different Activities within each Stage and the purpose of each Activity
  • inputs and outputs of each Stage

For example, the Package Dispatching Process of a web hand-crafts shop “Hand Made” is like this:

xin 032117 1

The goal of this Process is to send the ordered goods within 24 hours after receiving the Order.

The purpose of Stage 1 is to check the completeness and validity of the Order information: article name, quantity, payment information, client name, billing address, delivery address.

The purpose of Stage 2 is to prepare the package with the specified order.

The purpose of Stage 3 is to arrange the shipping within 24h after receiving the order.

The Process Performance Metrics can be defined either for the whole Process or for each Stage, and even for an Activity. Each Performance Metric represents one or multiple Performance Characteristics.

Continue using the example of the “Hand Made” process; a Performance Metric Example is defined below to show how to define the Performance Metrics on Process and Stage level following the attributes mentioned above:

Example 1 Performance Metric 1 – Effectiveness of the Process

  • ID: M1
  • Name: Effectiveness of the Process
  • Definition: this Metric indicates whether the ordered goods is shipped out within 24 hours after receiving the Order.
  • Performance Characteristic: Effectiveness, Timeliness.
  • Measurement Method: Calculate the difference between the shipping time and the order time.
  • Input for the Metric Measurement: shipping time, order time.
  • Measurement Output Registration: Order Management System.
  • Acceptance Value Criteria: < 24h.
  • Target Value: <22h.

Example 2 Performance Metric 2 – Effectiveness of Stage 1

  • ID: M2
  • Name: Effectiveness of Stage 1
  • Definition: this Metric indicates whether the received order contains complete and valid information: article name, quantity, payment information, client name, billing address, delivery address.
  • Performance Characteristic: Effectiveness
  • Measurement Method: If the completeness and the validity have been checked, rate 2. If only either completeness and validity is checked, rate 1. If none of them is checked, rate 0.
  • Input for the Metric Measurement: Order information
  • Measurement Output Registration: Order Management System
  • Acceptance Value Criteria: 2.
  • Target Value: 2.

How to determine the most important Performance Metrics to measure and monitor?

Since the Performance Metrics can be defined for different characteristics and different levels (Process, Stage, Activity), the total number of Performance Metrics could be huge. It is not realistic to measure and monitor all the possible Performance Metrics. Therefore the Process Owner needs to determine the Key Performance Metrics for the process based on the Business Goal. The Business Goal decides which characteristic of the Performance Metric should be measured. For example, the Business Goal of the Package Dispatching Process is Reduce the total Process time. Then the characteristic Efficiency should be certainly measured. Since the total time is divided into activity level, the performance metrics need to be defined till activity level.

What to do with the measured Performance Metrics?

As mentioned at the beginning, the purpose of measuring the Performance Metrics is to control whether the Process is executed successfully and meet the goal of the process. As part of the Performance Metric Definition, Target and Acceptance Value has been defined. If the Performance Metric does not meet the Target or Acceptance Value, it indicates that the process execution or even the process definition needs to be improved.

So the follow-up for the measured Performance Metrics would be gap analysis finding out what is the cause of the mismatch and what needs to be improved. The Performance Metrics should be regularly measured and improved continuously in case the result does not reflect the Process Performance explicitly. Following the TOGAF’s Enterprise Architecture Framework, the solution for solving the identified process performance gap will be evaluated, implemented and governed.

Xin 032117 2

In a word, in order to achieve the Business Goal of a Process, define the Performance Metrics, measure them regularly, improve the Process Performance and Performance Metrics continuously!

Adventures in Opportunity Canvasing, Part 3 of 3

The big day had finally arrived! Thanks to my earlier preparation (see parts two and three), I set up in record time and could sit and worry before everyone got there.

Apart from having the canvas up on the wall, I also decided to print off my template. I placed a few templates on each table so participants could get a closer look and read the prompt questions themselves. I also put pens, sheets of paper, and sticky notes on each table in the event people thought of something to contribute and wanted to write it down before forgetting. Alternately, if we decided to have them fill out the sticky notes and place them on the board themselves, they would need these materials. I wanted to make sure I was ready for a few variations to the meeting as I find once you are in a group you realize you have to change your approach. For instance, if no one was participating out loud, I could ask them to fill out some sticky notes on their own and then place them on the canvas as they talked about them.

To start things off, I had my key stakeholder give an introduction of the opportunity at hand and some background on why we wanted to explore it. Since he was from the business area the others operated in, I felt that he could tell a better story. Once he finished with his introduction, I then presented the Opportunity Canvas as well as some housekeeping rules such as not using laptops, when we will take breaks, and the Jellyfish rule. No one had questions about the approach so, we were off!

Here we go!

I was fortunate to have an active group of people who were willing to talk and share their ideas. I was able to write out sticky notes as they talked and placed them on the canvas. Some areas did require a little prodding, such as users and customers. I got them started with some example users and customers that I had generated during my dry run. From there, they were able to introduce other customers I had not considered, and we found a couple of segments with different problems.

Overall, we came away with many ideas for how to solve customers’ problems. We even had time to do a small exercise to order them in a way that we thought would provide the most value initially (those are the arrows in the Solution Ideas section). We also identified a customer segment that would be good to experiment with. Here is what our board looked like after:

haglof 021317

Would I do it again? What would I do differently?

I would use the Opportunity Canvas again. This technique, in particular, was a good way to focus a discussion, establish a flow, and make sure to hit the important points. There are still a few things I would do differently:

  1. Narrow the scope of the opportunity and present that scope at the beginning of the meeting. I knew this opportunity was large to start with, and I should have picked the part of it to focus on. I found people straying to other topics that were closely related, but not in scope.
  2. Tie the solutions you have today with the problems to help identify additional problems for your users or customers. For instance, if one solution today is calling the company, and you have limited call hours, a problem for customers is finding time during their work day to contact you.
  3. When completing your user and business metrics sections, try your best to put them in the form of a hypothesis. This makes it easier to setup measurable goals in the future when you start to gather data. In fact, having people set up the hypotheses with specific time frames and measurements is even better. Teresa Torres has a good, measurable hypothesis format, you can find it here.
  4. Gather any initial data, statistics, or research you can prior to performing the Opportunity Canvas discussion. There were a few times participants asked about specifics like “How many customers do this?” or “How long does this process take?” I believe having answers could have resulted in identifying more problems or solutions.

More broadly, I have convinced myself to practice new techniques or methods more often, even if it means barricading myself in a small conference room. I read a lot of articles and books every week about lean methods, requirements gathering practices, how to build a roadmap, etc. For everything I read, I lose about half of the knowledge, because I do not try it right away. This was the first time I was able to try something, with a large group, shortly after reading it. Practicing it helped cement the learning.