Tag: Planning

4 key activities for a Business Analyst in the Alpha phase

On one of my earlier blogs, I described what I thought are the 3 key activities a BA should be doing when they were in a Discovery phase of a project.

The feedback I received was positive so I thought I’d give, what I consider to be are the 4 key activities are for a BA in an Alpha phase.

So what exactly is an ‘Alpha’?

In the UK, the Government Digital Service (GDS) defines the phases in an Agile delivery lifecycle as; Discovery, Alpha, Beta, Live and Retiring the service. GDS also cover in detail how the Alpha phase works, but what’s not covered in the article is what each role in a delivery team does within an Alpha, including Business Analysts.

If you’re not familiar with the names of these phases, they are the same for pretty much all Agile project delivery. The most common themes I’ve come across are;

  • Concept, inception, iteration, release, production, retirement

Moving Discovery outputs in to an Alpha

Key outputs from the Discovery the BA should have been heavily involved in include:

  • Stakeholder analysis
  • Understanding and defining the problem
  • Starting the product backlog

Each of these outputs now need to be taken through in to Alpha by the BA and here’s how.


Advertisement

Stakeholder analysis – Use your stakeholder knowledge

An Alpha to me is the exciting part of the Agile delivery lifecycle as this is where you actually start putting ideas and concepts in front of users and you learn ‘how’ they will really interact with your product and get valuable feedback. To ensure you get as honest and realistic feedback as possible, it’s important to try and create as real-life scenarios as possible to test the prototype with users. To do this, the BA should use their knowledge of working with stakeholders in Discovery and take this in to the development of the prototype with the designers on the team. After all, if you were the BA involved in Discovery, one of your key outputs is understanding the users and their needs, and that includes the needs of the business. Therefore, armed with this insightful knowledge, you should work closely with the design team to ensure they also understand the users. 

Understanding and defining the problem – Keeping the product vision in view

During Discovery, the team will have (or certainly should have) defined the problem that needs to be fixed and from that, a product vision should also have been defined. Roman Pichler has an excellent article on how to create a compelling product vision which I highly recommend you read as well as all the other articles he has on his website. 

For me, the product vision is one of, if not the key outputs from Discovery and is something that should be visible and referred all the way through the delivery lifecycle. All too often I’ve seen the product vision put up on the team wall (or worse, in a folder on the Product Owners laptop) but no one seems to take any notice of it and it becomes just a part of the wall space along with user research findings, sprint boards, etc. To make sure the product vision stays in view, and you have wall space, have it beside your user story map (coming up in the next section). Pretty much everything that’s in your user story map should stem from the product vision, so keep them close together.

Starting the product backlog – Make sure prototypes stem from user needs (building your user story map)

How prototypes are developed is different for all teams but in my view, the quicker you get to an interactive prototype, the better. I’m all for sketching out designs to protect costs and save time, but only once a prototype is in the hands of users and seeing their interactions with it, will you start to get valuable (and workable) insights to develop the prototype further. And remember, as the BA, you’re going to start building the product backlog based on the findings and create your user story map. If you’re even half serious about being a Business Analyst, I don’t need to tell you the powerful impact of user story mapping but if you need reminding, here’s Jeff Paton (the guy who came up with the idea of user story mapping) showing you how to create one. 

Help the team design iteratively

Having your user story map on the team wall (or online if you are a in several locations. I recommend www.storiesonboard.com as a user story mapping tool) is a great way to galvanise the team and ensure what you’re doing aligns with the product vision (hence having the vision next to the map). As we know, agile delivery focuses on building products in an iterative way and this principle should apply to designing prototypes in Alpha. I quite often see designers go off and start building complex, end to end user journey. For this very reason, having a user story map will encourage the design team to not think too far ahead. After all, your map will have an ‘MVP’ (or Release 1 if you’re not comfortable with the term MVP) swim-lane where you’ll define as a team what features will (or might) go in the MVP and this is what the design team should be focusing on prototyping.

And finally…

Don’t misunderstand me, and this is based on the feedback from my ‘BA in a Discover’ blog, these are not the only 3 activities a BA will carry out in an Alpha and you will no doubt carry out more than this (e.g. writing the user stories for Beta, working with technical architects/software developers to ensure what is being designed and tested with users can actually be built, continually developing the backlog, etc) however I’ve seen projects where the BAs have not been involved much in the design process and this which has led to problems further down the delivery process. Remember, you as the BA are the bridge between the design team and the developers/testers!!

An Alpha (or iteration) phase can last several weeks and if you as the BA follow these activities, you’ll ensure the product is designed with the users in mind, in an iterative way, and that when you get to the Beta phase (blog coming soon), your product will be delivering the value defined by the product vision.

What your burndown charts are telling you

When I was introduced to scrum, the burndown chart was a tool that was highly emphasised however I feel the purpose has changed

from it being a tool to predict (to a certain level) timescales for delivery to a tool that measures a team’s productivity…..in other words, the focus is on the number of points cleared which in my eyes, drives some adverse behaviours.

In this blog, I’d like to show some example burndown charts I’ve come across in teams I’ve been part of as a Business Analyst and what they should be telling you about how the team is operating. I’ll also offer some suggestions to fix what could be barriers to becoming that high performing agile team we strive to be.

So what is the purpose of a burndown chart?

A couple of quotes:

‘Burn down charts are a run chart of outstanding work. It is useful for predicting when all of the work will be completed’- Wikipedia, 2019 <“>https://www.mountaingoatsoftware.com/agile/scrum/scrum-tools/release-burndown>

We can take it from both of these quotes that the purpose of the burndown chart is to be able to visually see progress through a sprint, however I’d like to emphasise Mike’s point in his description that it ‘is a way to clearly see what is happening…during each sprint’. On many of the teams I’ve worked on, if not most, burndown charts are not reviewed at all but only looked at if someone outside the team wants to see them.

I’m well aware every burndown chart will have its own unique story behind it so when I give what I think are reasons behind the chart in the examples below, I’m only hypothesising from my own experiences. And while the burndown doesn’t tell the whole story, in my experience the analysing of them (with the whole team of course) has always improved the ways of working and that is the purpose of this blog.

Note: in the examples below, each sprint is 2 weeks long with the grey line depicting expected burndown with the red line the actual.

Example 1

The ‘Manhattan skyline’ burndown

BATimes APR2 1 2020

Possible reasons

Ok, it’s not exactly like wonderful Manhattan but you get the idea (up and down peaks across the sprint). I think the two key parts of this burndown are the long flatlines at the beginning and midway through the sprint and the spike 3 days in. While this doesn’t affect the sprint points (what points/stories have been added have then been removed), it suggests the team weren’t confident of completing what was going in to the sprint for a significant increase (30 points). Or possibly, the stories weren’t ‘ready’ for the sprint. Also, have the team bitten off more than they can chew during sprint planning as there are 10-20 points left on the table at the end of the sprint?

How to fix

During sprint planning, ensure all the stories that are sprint candidates have met the team’s ‘Definition of ready’ and the team are confident that those stories that are being taken can be completed within the sprint. This may take some time for the team to get to this point as estimation and sprint planning (for me) are the two areas of Scrum that take most time before the team are comfortable with both aspects. And in my experience, if the team get these elements right (well estimated stories and confident planning), sprints tend to go pretty much as planned.


Advertisement

Example 2

The burn down-up-down-up chart

BATimes APR2 2 2020

Possible reasons

I think it’s fair to assume this team is clearly having problems as you can plainly see but what might be the potential cause of this erratic burndown (or burn across!!)? Firstly, it’s clear the team have taken on way too many points for the sprint. Of course, there could have been an issue near the end of the sprint that caused the team to stop developing but even so, to fall short by 30+ points should be saying something. Long flatline periods suggests stories weren’t small enough to deliver incrementally. Large increases in points mid-sprint suggests the team have not been disciplined enough in saying ‘no’ to new stories being added. If these stories had not been added (20+ points), then the team may have achieved its target.

How to fix

Don’t be fixated by how many points can be done in a sprint. Just because the team did 60 points in the previous sprint, don’t assume the team can do it again the following sprint. I’m a big fan of Mike Cohn’s ‘Capacity-driven planning’ and I feel it’s the team’s responsibility to confidently be able to say, ‘yes, we can commit to everything in this sprint’. In velocity-driven sprint planning, I tend to see the thought process of what was achieved last sprint and therefore what stories can we cram in to achieve the same number of points or more. I think this approach is counter-productive and brings wariness to the team’s ability to confidently commit to the sprint. Therefore, ask the question, ‘what can we confidently achieve in this sprint?’ as opposed to ‘how many points should we do in this sprint?’

Example 3

The Flatliner

BATimes APR2 3 2020 

Possible reasons

My first thoughts on seeing this burndown was, ’should you even be using agile as a framework for delivering your project?’. I think you’ll agree that from day 1 of the sprint, 35 points have been added before work’s even started. Then there are no points (or virtually no points) cleared for 8 days before a big drop of 20 points and with still 40+ points left on the table. It could be this team is very early in its agile journey and therefore are unclear on their velocity (hence so many points) but still, loading up a sprint with no idea as to velocity suggests immaturity of an Agile delivery framework.

How to fix

In my view, the type of work being carried out by the team might suggest they’re unable to deliver iteratively and therefore may be better suited to a Kanban than a sprint approach. It could be they require the use of an Agile coach or Scrum Master for a period of time to set them on the right track and start from a position where they can clear what stories they take in to sprint and build up their velocity.

Conclusion

I hope those reading this are familiar with these types of burndown charts or if you’re new to Agile and you’re utilising burndowns, my point here is to make sure you use them to analyse how the team is performing and how that performance can be improved. Of course, your retrospectives are the perfect forum to do this.

I should make a couple of points though. Firstly, don’t look at a burndown chart in isolation. I’d look at the last 3-5 to see if there are patterns emerging before you embark on working to improve. Do they look the same or do they look completely different over a period of sprints?

Secondly, don’t place too much emphasis on them. You might think that’s odd as that’s what this blog is about however, as I mentioned, each sprint is unique and each burndown will have some sort of story behind it so use them as a discussion point for the team to improve, and not the be-all and end-all to improve the team’s performance.

As a Business Analyst, I nearly always find the reason why teams don’t deliver in small increments during a sprint, and therefore creating the burndown chart examples in this blog, is down to the user stories. No that user stories are the be all and end all but invariably I find it comes down to the stories either not following the INVEST model or them not being ‘ready’ for the sprint. If you get this part right then your sprints should run smoother and your burndown chart will reflect that.

So don’t ignore your burndowns (or burnups if that’s your preferred method), and if the team’s struggling to complete its sprints, spend some time analysing them to see where the team can improve.

Measuring Business Analysis Efforts: The KPIs That Matter in 2020

Not so long time ago, the business analysis used to refer to a job of a person employed as a business analyst, mainly in a corporate setting.

However, we often forget that business analysis is a whole discipline that includes tasks and techniques that analyse the structure, policies, and operations of a company so it can recommend solutions that lead to achieving its business goals. To be effective, though, business analysts need specific KPIs (Key Performance Indicators) that include criteria on which individual performances are evaluated.

Process optimization KPIs

The percentage of Business Process Productivity Increase is observed as the actual increase in productivity after a new system was implemented. The percentage of Cycle Time Reduction is a cycle time reduction after the system was implemented. Unit Cost is defined as the reduction of unit cost within a 6-month period after the new solution is introduced. Increase in Revenue as a Result of Solution is the fourth indicator that refers to the actual increase of revenue as attributed to the solution. 

Project value KPIs

The first one is the Deviation of Planned ROI, which is the difference between the actual ROI and ROI in the planned baseline. Deviation of Net Present Value (NPV) is the deviation in value between the planned baseline against the actual net present value. Deviation of Planned Break-even Time is defined as the differences in time between the actual break-even time and the planned baseline, in which the business costs are equal to the generated income.

Quality effectiveness KPIs

Percentage of Rework Attributable to Requirements can be expensive, amounting up to 40% of the total budget, while up to 70% falls on inaccurate or ambiguous requirements. Percentage of Projects with Prioritized Requirements identifies which projects to prioritise to ensure that only high-value items are taken into consideration. Percentage of Requirements Fully Implemented allows business analysts to track requirements through testing, proper designs, and accurate deployment.

Percentage of Approved Requirements Not Implemented evaluates the performance of the overall user experience and satisfaction with the result. Developer Requirements Satisfaction Index allows developers to express their satisfaction with requirements in the form of a survey. QA Requirements Satisfaction index includes survey results from QA that maintain the testability of requirements. Requirements Tested (%) shows what percentage of requirements were actually tested and which ones were not.


Advertisement

Digital marketing KPIs

Digital Marketing KPIs are quantifiable goals that help you track and measure the success of your marketing campaigns. By creating a specific digital marketing KPIs such as web traffic sources, cost per lead, online conversion rates, and customer lifetime value, analysts can identify targets and goals, but also measure business performance based on those value. Monitoring and reporting on so many KPIs aren’t only stressful, but also time-consuming unless analysts are using digital marketing reporting software that automates the process by integrating multiple data access points into real-time dashboards that are easy to read and report.

Project management KPIs

These KPIs are used to measure the performance of project management. Deviation of Planned Expenses is the difference in total costs between the actual budget and the planned baseline. Cost of Managing Processes is described as periodic process managing costs typically based on the number of Full-Time Equivalent (FTE) personnel involved in management functions of processes, which is then compared against the percentage of FTEs actually engaged in a project that were not initially assigned.

Budgeted Cost of Work Scheduled (BCWS) defines the cost of activities that are planned and scheduled for completion. Sometimes the ‘planned value’ term is used. Actual Cost of Work Performed (ACWP) is the sum of the actual costs of completed activities. Budgeted Cost of Work Performed (BCWP), also known as Earned Value is the sum of the planned or scheduled budget for completed activities. Cost Performance Index (CPI) defines the earned valued divided by the actual costs, while Cost Schedule Index  (CSI) multiplies the CPI by SPI (Schedule Performance Index) to measure the likelihood of recovery for a project that has breached its budget or timeline.

Project portfolio KPIs

Alternatively, business performance analysts may evaluate the KPIs by looking into the project portfolio. The Percentage of Initiated Projects Without Business Case identifies projects that have missed important milestones, while the Percentage of Challenged Projects defines those that have either exceeded budget by 15%, delivered two months after the deadline, or failed to deliver the major scope of the project.

Stakeholder engagement KPIs

Stakeholder Satisfaction Index is defined as a series of interviews that determine overall satisfaction with the requirements. On the other hand, the number of Stakeholder Comments Received shows the total number of concerns and comments given by stakeholders with respect to the given requirements. Stakeholder Lifecycle Participation results from the total number of stakeholders who take part in lifecycle events and is usually shown as a percentage.

Further on, it’s important to determine the number of Key Stakeholders Not Identified or only identified in later stages of the project, as well as the number of Participating Stakeholders Interviewed or taken part in focus group discussions and events. The percentage of Stakeholder Attendance is defined as the percentage of stakeholders who turned up during meetings against the number of stakeholders invited. The number of Needs Recognized by Stakeholders identifies the number of needs that were successfully reconfigured as requirements.

Defining the essential KPIs is an important skill for anyone working on business improvement analysis. These indicators are usually captured or received from a combination of reports, surveys, spreadsheets, and charts where a developer determines target performance levels and identifies the variance from those target values.

AI and the Digital BA—What’ It All About? Part 3

This is the last of a three-part article written with answers to some of the most frequently-asked questions I get about artificial intelligence (AI).

In Part 1, I addressed some common terms and issues related to AI as it is used in a business context. In part 2, I focused on the various roles that BAs play on AI efforts. In this article I will discuss various subjects like the need for AI translators, the importance of AI governance, and the digital PM. As with Parts 1 and 2, I will use a Q/A format.

Why is the role of AI translator so important?

Recently there have been numerous articles in journals like Forbes and Harvard Business Review (HBR) about the need for an AI translator role, someone who acts as a go-between between the organization’s data scientist and strategic decision-makers. These articles don’t mention the BA specifically, but their descriptions are consistent and describe a role that BAs have routinely played—that of ensuring that business stakeholders and technical staff understand each other. I think the AI translator is a perfect role for any experienced BA. Data scientists need to understand the strategic direction of the organization, the business need for the initiative, and the related business rules that will be required on many of the AI systems. Business stakeholders need to understand the impacts of their decisions.

In the early days of AI, it was not uncommon for data scientists to guess at the business rules and make AI-related decisions themselves. This did not go well, as documented in Computer World.[i] The next phase was to have data scientists get input directly from the business. This, too, did not go well. So some organizations have introduced an intermediary role—the AI translator. They understand that they need to have someone who understands the importance of business input and who can also speak comfortably with the data scientists—a translator role. That’s where the BA comes in. We’ve always been translators. Translating the requirements into designs and back to ensure stakeholders get the functionality they ask for and really need. Yes, this is a perfect role for the BA and one that can greatly contribute to successful AI projects.

How much governance is needed on AI initiatives?

Many of the challenges on AI initiatives are no different from those on other projects. In a survey published in Information Magazine in July 2019, respondents included these factors as the major challenges:[ii]

  • 50% – Lack of leadership buy-in
  • 49% – Lack of metrics, especially surrounding data (bad data, ownership, etc.)
  • 37% Internal conflict
  • 31% Time required to implement (takes longer than expected)
  • 29% Unexpected costs

What do these factors have to do with governance? Each one directly relates.

  • Executive buy-in. Among other things, no executive buy-in makes it almost impossible to reach consensus on the need for and nature of governance itself.
  • Data metrics. Governance guides such metrics as how accurate historical data needs to be.
  • Internal conflict. Governance establishes guiding principles around conflict, how it will be resolved, and by whom.
  • Time and cost overruns. Project governance will help such things as keeping projects on track, how and when to communicate when they’re not, and even what “longer than expected” means, so forth.

Advertisement

The article goes on to suggest that in order have successful AI initiatives, organizations need to hire data stewards to manage and coordinate the organization’s data. The data steward would be a steward in the real sense of that word: someone to manage, administer, and generally take care the data. In order to manage and administer, this role needs to help the organization determine what that governance will work and then to be responsible for its governance. Sounds like a BA!

In a podcast, cited in Harvard Business Review (HBR) in August 2019, De Kai and Joanna Bryson join Azeem Azhar to discuss the importance of governance on AI initiatives.[iii] They define governance as coordinating resources involving both internal AI modules and humans. They suggest that there needs to be an independent, oversight group with the authority to apply agreed-upon governance, and I think the seasoned BA is in a perfect position to facilitate this group.

Is there such a thing as a digital PM and if so, how does that role differ from a digital BA?

Digital BAs are similar to all BAs in that they do BA tasks, use BA techniques, and need the same BA competencies (see Part 1). Likewise, digital PMs do PM tasks, use PM techniques, and need PM competencies. They work with the sponsor to charter AI projects and help organizations implement them. Although not yet a common role or title, having someone with experience managing AI projects can be valuable to organizations. Again, they’ll still do their tasks and use their techniques appropriate to PM work, but being a PM on an AI project and coordinating all the resources entailed on such an initiative will most certainly require a healthy working knowledge of AI.

Another way to look at digital PMs is that they use AI systems and tools to manage AI projects. In an article in Forbes Magazine on July 2019, the author focuses on the use of automated AI systems and tools to help digital PMs manage their projects.[iv] He says, “AI, with its unique ability to monitor patterns, is a capable assistant to PMs.” In addition to helping with the routine admin tasks, AI can provide all kinds of predictive analytics. AI tools can look at hidden complexities and all the moving parts inherent in a complex project or program and predict areas of concern, from project slippage to team members behavior and more.

The digital PM, then, is one who not only takes advantage of AI tools to do a better job of managing projects, but also has enough AI expertise to manage complex AI projects.

Does “digital” have to be related to “AI?”

In the past, the term “digital” was used broadly. It referred to any digital project, like development of a website, digital marketing, or developing the organization’s presence on social media. Nowadays the term is generally used to refer to “AI,” which encompasses all things related to machine learning, predictive analytics, and data mining. More recently the terms “AIs” and “AI systems” are also commonly used.

I hope you have enjoyed this three-part series. Look for more AI-related content in the future.


[i] https://www.computerworld.com/article/2484224/12-predictive-analytics-screw-ups.html, Robert Mitchell, July, 2013

[ii] https://www.information-management.com/opinion/data-governance-in-the-age-of-ai-beyond-the-basics, Data Governance in the Age of AI, Gienna Shaw, Information Magazine, July 19, 2019.

[iii] https://hbr.org/podcast/2019/08/governance-in-the-age-of-ai, Podcast, De Kai and Joanna Bryson

[iv] https://www.forbes.com/sites/cognitiveworld/2019/07/30/ai-in-project-management/#195242a6b4a0,, Forbes, Tom Schmelzer, July 30, 2019

Mind Maps for Business Analysis

The purpose of this article is to demonstrate the use and benefits of Mind Maps for business analysis.

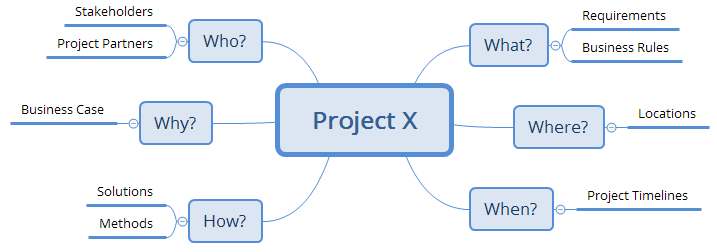
The 5W mind map uses the journalists’ five questions (Who, What, Where, When, Why) plus How to provide a template for a business analysis guide that can be used through the project lifecycle.

This technique is the first action I take for every new project, giving me a project overview that is then used as a check list and visual reminder during the course of the project. I use a free download version, but there are many mind mapping tools available and the paid versions offer more sophistication for presentations and integration with other project tools. (The mind map tools provide the ability to embellish your view with markers, images, colors and labels, but beware of drowning your big picture in a pool of emoji’s).

The diagram below shows the 6 major topics, and the initial round of sub-topics for each. The choice of sub-topic may vary with your project or your own area of responsibility.

BA Oct17 1

USAGE BY KNOWLEDGE AREA

The mind map will grow and change during the course of the project and can be used under each of the BABOK knowledge areas as follows:

  • Business Analysis Planning and Monitoring
    • At the start of each project, create a new mind map to organize and coordinate plans for the analysis tasks
    • Add information from the project proposal to each topic
    • Use the mind map tool to expand the sub topics as knowledge is gathered
  • Strategy Analysis
    • Identify stakeholders and project partners under Who
    • Record the high level business case under Why
  • Elicitation and Collaboration
    • As requirements are gathered, add the high level business requirements and business rules under the What topic
    • Record sizing and usage estimates against Who, How or What
  • Requirements Lifecycle Management
    • Use the mind map during the course of the project to maintain focus on the high level requirements and to reinforce relationships between and justifications for requirements
    • Use to analyze proposed changes
    • Print out the mind map and pin to your wall or the project war room for all to see, especially during team discussions when members need to be anchored
    • Refer to the mind map when developing presentations to stakeholders and project teams to maintain consistency over long projects
    • Update the mind map during the course of the project, maintaining version numbers
  • Requirements Analysis and Design Definition
    • Validate the requirements against the other project topics
  • Solution Evaluation
    • Identify key aspects of the solutions and delivery methods under How
    • Record implementation locations and delivery sites under Where

Advertisement

USAGE BY TOPIC

Each topic provides an opportunity for the BA to start shallow and take deep dives. Add all findings as you go – but do not hesitate to remove or edit as new facts or requirements are discovered.

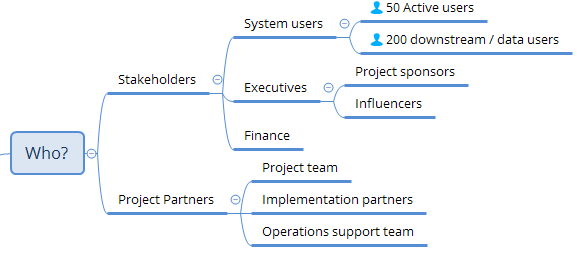
Who – Stakeholders and Project Partners

The key stakeholders of the proposed system should be identified in the project proposal, but stakeholders are also uncovered during the life of the project. An example is downstream consumers of the product or data being delivered. User estimates can be noted against active and downstream users.

Making a note of the executive sponsors and influencers serves as a flag to follow up when there is an organization change or an executive mind shift. How will that affect your requirements? The BA should be aware of other partners such as Finance, delivery team, and the planned support team as potential influencers of the system requirements.

BA Oct17 2

What – Requirements and Business Rules

Detailed requirements and user stories should be left out of the mind map, but they should map back from your requirements management tool to the mind map. The requirements in the What topic serve as a guide and constraint on the detailed requirements. There should be sufficient information so that the mind map is a stand-alone overview for when you are faced with an executive in the elevator asking what this project is about.

Where – Locations

The Where may prove to be not significant for a particular project, but including this in your initial template provides the opportunity to consider first then ignore – rather than ignoring first. Will the infrastructure be hosted in a public cloud or in-house servers? Will there be international users? Will the support be local or outsourced. The requirements must cover these variables. The delivery variables

When – Project Timelines

Making a note of the high level project timelines at minimum completes the overview of the project, but this branch may also include requirements analysis plans, sprint plans, and/or key business event dates.

How – Solutions and Methods

The Business Analyst is not responsible for technical solutions or project methodologies, but these may have an impact on requirements, and therefore the BA should be aware early of technical decisions such as COTS or Build, In-house or Outsourced, Agile or Waterfall. Record just enough information to show how the technical project decisions support the requirements. Sizing estimates should be recorded here because the technical solution should be compatible with the expected traffic and data volume on the system.

Why–Business Case

Recording the high level justification for the project provides another guideline reference for the business analysis work, and red flags during requirements analysis.

BENEFITS

The following section lists benefits from using mind maps for project and requirements management. In addition, I find them just fun to use. I was hooked on mind maps from the day our new Director introduced himself to the team through a colorful and informative mind map of his resume and interests.

  1. Generate discussion and ideas. The loose structure of the visual and the flexibility of the software work together to open minds and to overcome reluctance to offer ideas and changes.
  2. Multiple perspectives. The mind map shows horizontal and vertical perspectives. The drill-down design allows viewers to see big pictures and their underlying details in a single view. Discussions can go down rabbit holes into the detail but the presenter has a tool to bring them back to the shared big picture.
  3. Highlight relationships. The central positioning of the major topics in the 5W template provide the horizontal perspective, and makes the viewer think about the relationships between topics. How does the project methodology impact the requirements delivery? Do the requirements match the business case? Do the requirements reflect all locations and stakeholders?
  4. Easy to recall. Mind maps create a visual representation of your project, and the picture really can be worth a thousand words. Visuals are easier for memory retention than pages of words.
  5. Enable change. Today’s software development environment is short and agile. The BA operates in an environment driven by change, disruption and transformation. The 5W mind map enables free thinking within defined boundaries, and also provides an impact map to assess shifts and changes.

SUMMARY

The 5W mind map is a useful tool for requirements planning and management. The starting topics of Who, What, Where, When, Why and How provide a check list when collecting requirements and a reference during the life of the project.

The attached file presents an example of a 5W mind map for a hypothetical project to provide digital signage at local swimming pools.