
Tag: Change Management

Pet Rats and Change Controls

A stigma has often been associated with change controls or change requests in regards to requirements of a project.

There is this aura around the words “change control” that gets a negative reaction from stakeholders and BA’s alike. It usually means there is added work to the project. Which, in turn, means the requirements will have to go through the approval process again. If you have read my previous article, then you already know my love/hate relationship with the stakeholder approval process.

Even so, I like to think of change controls as the misunderstood animal of a project’s lifecycle. Take rats for instance. They are often represented in the film industry as disgusting creatures that eat garbage from dumpsters and live in the sewers. They are also blamed for spreading the bubonic plague even though they were simply a host for the disease-carrying fleas. No one ever thinks about the “goodness” in rats. I prefer to think of rats in the light of Master Splinter from Teenage Mutant Ninja Turtles. They are quite affectionate and rarely bite people. They are extremely intelligent and can perform tricks if trained properly; similar to a dog. If you take care of them well enough they will love you always.

One look at my daughter’s pet rat jumping from a chair into her arms 5 feet away after being coached to do it changed the way I view rats forever. One word. Adorable.

Now. I don’t think that I will ever call a change control “adorable”, but like rats, they are often misunderstood. Yes, they create more work for all parties involved. Yes, we have to go through the approval process one more time. However, they provide a better end solution or product. They are often necessary to express clarifications or add a missing piece to the solution. Just because a change control is needed doesn’t mean someone made a mistake or didn’t do their job. On the contrary, we need a change control because someone is doing their job. Someone noticed something missing or incorrect and requested to have it fixed.
In order to reduce or even eliminate all together the stigma surrounding change requests we, as BA’s, need to educate ourselves and our stakeholders. What is a change control? What does it mean for me? Is it good or bad?


Advertisement

What is a change control?

According to the BABOK, a change control is “controlling changes to requirements and designs so that the impact of requested changes is understood and agreed-to before the changes are made.” (BABOK, 2015)
In essence, it doesn’t mean that someone missed a requirement. Although, this may happen. No one is perfect; therefore, no project team is perfect. Requirements may get missed or a better solution may be presented that affects the requirements. The change control documents these changes within the requirements.

What does it mean for me?

As a BA, we are change agents. In my opinion, the term change agent should be in every job description for any BA role. So, if we are change agents why are we so afraid of change controls? I think, often times, we look at the negative associated with change. At least, initially. I know from my past experience I would view the need for a change control on requirements as something that I missed or something I got wrong, which means I failed. I’ve learned that we need to accept change. There are things that are out of our control and we need to be flexible to make changes that benefit the project. Remember, you are not alone. You are part of a project team. The requirements were created together with everyone’s input considered. We are all accountable, so to not accept the change needed may negatively impact the project as a whole.

Does this mean we just accept any change control?

No.

Each request will need to be evaluated for benefit and impact on the project. If the benefit is high and the impact is low, then it may be a no brainer to create the change control. If the request is somewhere in the middle more analysis is needed to identify the cost, benefit, duration, and resourcing before creating the change control.

Are change controls good or bad?

Change controls are not characteristically good or bad. They are a necessary cog in the project lifecycle. Without change controls, we risk introducing a solution that is not complete or not what the stakeholders requested. If there is a better solution or a clarification needed to the requirements it is the BA’s job to document, it. We need to stop looking at change controls as “bad” and look at them as sometimes “needed” in order to fulfill our duties as a BA.

In the end, you will be thankful that change controls are made because it will avoid rework later in the project lifecycle, internal audits against projects, poor customer experiences, and provide better customer solutions.

After all, if you had a pet rat, wouldn’t you want it to show you affection and know all the tricks?

References
BABOK®: v3: A Guide to the Business Analysis Body of Knowledge (2015). pg. 443. Toronto: International Institute of Business Analysis.

Surviving as a Business Analyst in a Product-Centric world

According to the IIBA, “a Business Analyst (BA) enables change in an organizational context, by defining needs and recommending solutions that deliver value to stakeholders.”

However, Business Analysts (BA) are often viewed as simply requirement recording machines. Agile methodologies have allowed the BA role to evolve, by limiting the focus on documentation. However, the next step in the evolution of Business Analysts is to don a product management hat to develop stable, scalable and innovative solutions. Here I outline a guide to help analysts create more elegant, effective, creative and expansive solutions using a product-centric approach by keeping the user and business as the core focus.

What If

As usual, you want to start with identifying the needs of your users by articulating and framing the need statements. If you are working on a new product, outline “what if” statements, which test the status quo, such as for e.g. “what if our customers can access their medical records on the go.” These questions enable you to think outside of your constraints and leave you open to all possibilities. Put together multiple statements with your team and consider these your hypotheses. Make sure you involve your stakeholders from the beginning, so you don’t have to convince them for approvals later. With each statement, ask yourself:

  1. Does this help you maximize the impact?
  2. Does the situation work in multiple contexts?

You can use this worksheet to complete your “What If” statements.

Make First, Document Second

Make first, document second may sound counter-intuitive, especially if you are a seasoned BA who is coming from waterfall background; but you don’t have to document anything at the moment. Once you are done with your “what if” statements, create prototypes that will validate your hypotheses. Prototyping is a great way to make your idea tangible. You can get quick feedback from your end-users to help you with capturing acceptance criteria and use-cases. It can also help you get buy-in from stakeholders, who would be convinced by working software. Your prototype doesn’t have to be a finished product. It can range from an image, wire frame, digital mock-up or storyboard that would help you communicate your idea to the end-user.


Advertisement

Just make sure you observe how your end-users are getting engaged with it and what questions it generates. You can use this worksheet to guide you with capturing the necessary data. Capturing this data will help you immensely with your requirements documentation as well since it will be insight driven and you can determine possible use cases as you observe their interactions with the prototype. You can capture your learning on Typeform, Google Forms or Murals. Some of the tools that can come handy for prototyping are POP, Proto.io, or Sketch.

Go Out of the Building

We usually are sitting in front of our screens, playing around with the current systems, creating diagrams and defining processes. This may be effective when we know what we need. Going out of the building is a metaphor used to test your hypothesis with actual users to understand their pain points and get a perspective of the environment your solution will be used in. Connect with your users and ask them, if they would use your product/service and give them your prototype to play around with. Keep a close eye on them while they are playing with your product. Remember you are just validating your hypothesis, so don’t be biased towards it.

Refine and Prioritize

Once you know you have the pain points and solution defined, take a step back and assess the merits of your solutions by questioning the impact of it and what resources would it require to be implemented. This would allow you to get a sense of direction and have a product roadmap by the end. You can connect each concept and feature with a specific set of goals that the solution would achieve for your organization by answering the following three questions:

  1. Viability: If it addresses the long-term strategic goal of the business.
  2. Desirability: If it provides value to the end user.
  3. Feasibility: If it will be viable to develop and what resources would be required.

This worksheet will help you prioritize, refine and put solutions in perspective.

Once you have these questions answered, you will be able to start from the top and implement these features one by one. Our job as business analysts doesn’t end in the solution phase. We need to be engaged continuously in the process to assess the usage of the solution and how it is impacting the business.

User Stories and Mapping

User Stories and User Story Mapping are must have techniques for a Business Analyst.

You can do business analysis without SCRUM, but you can’t do good SCRUM without Business Analysis. Story Mapping enables clarity of user stories.

Agile Alliance talks about the benefits of User Stories, “One intent of this practice is to avoid a failure mode of incremental delivery, where a product could be released composed of features that in principle are of high business value but are unusable because they are functionally dependent on features which are of lower value and were therefore deferred to future releases.”

That’s a pretty in-depth explanation, but in general User Stories help create a higher quality product for the customer. Sunit Parekh sees it as more collaborative, “Story Mapping is an engaging activity where all participants are involved in the process of building the product backlog on a wall, versus writing a dull 100-page requirement document.”

In an interview with CIO Magazine Steve Rogalsky with Protegra sees user stories as more visual. “It allows you to see the big picture in your backlog,” says Rogalsky.

User Story Components

According to Mountain Goat Software, “User stories are short, simple descriptions of a feature told from the perspective of the person who desires the new capability, usually a user or customer of the system.” A typical User Story consists of:

As a < type of user >, I want < some goal > so that < some reason >.

Know Your Stakeholders

Having knowledge of the process enables bringing the identification of stakeholders into the picture. The additional identified stakeholders help validate whether user stories are accurate and will allow the project team to introduce change management activities early. One change management strategy which User Story Mapping encourages is to facilitate stakeholder buy-in. Stakeholder buy-in is vital and benefits the project team as these stakeholders can help develop additional user stories that the project team potentially have missed, elicit business impacts and helps validate design and prioritization discussions.


Advertisement

Requirements Are User Stories

User stories capture requirements and can be used to model a meaningful sequence of user activities, perpendicularly across a prioritized ranking of user stories. The benefit of which encourages richer discussion in planning and prioritizing user stories, further engages stakeholder participation, is a mechanism to help understand business impacts and can allow a team to see how user stories affect the customer journey visually.

Story Mapping

Story Mapping is about taking a series of User Stories and putting them together in a meaningful and visual way.

J Patton Associates says, “Story Mapping is the process of arranging user stories into a useful model to help understand the functionality of the system.” This technique allows for the planning and prioritizing of requirements in order of importance and value. The Agile Alliance elaborates story telling a little further, “Story Mapping orders user stories along two independent dimensions. The horizontal axis is depicting the user activities in order of priority or the sequence of process activities and the vertical axis depicting the release or project milestones.”

Magalong 071917 1

Once used, story Mapping can enable the project team to dice stories (often at Epic level) horizontally into the main functionality. This horizontal view is important as it visually represents the value stream of the designed solution. This analysis allows the project team to understand the dependencies and highlights gaps for how the created User Story functionality will work. This end to end perspective enhances understanding the customer journey of a person using the solution.

The vertical axis is important as it represents the project teams User Story release plans. Project team centers discussions on which user stories are high value and easy to develop. Leave complex user stories to later releases. This focuses the project team on creating a minimum viable product (MVP) for the customer. Sprint reviews can help fine tune the product and allow the project team to assess User Story release patterns regularly. The vertical positioning of user stories enables the project team to discuss whether user stories are prioritized in terms of need, value, and complexity.

Story Prioritization

Prioritization of User Stories can help build the User Story Map. User Stories seldom keep their same priority throughout the cycle so be prepared to re-prioritize often. High-Medium-Low prioritization sounds easy, but everything winds up as high priority. Use the hot air balloon technique for prioritization. Is this User Story more or less important than this User Story? Comparison of user stories to each other brings out additional discussion on risk and why a User Story is more important to the overall customer experience.

Greater Detail

User Stories are high-level by nature. System Requirement Specifications (SRS) are more detailed and lower level in nature. Depending on the project you might need to use both User Stories and System Requirement Specifications together to create a User Story Map. Thinking about how the User Stories relate to each other in a logical flow for the developer, release to the customer, and other technical, environmental issues will drive putting together a Story Map.

Complex User Stories are typically a good candidate for more technical details. Get details when trying to fit a User Story on the Story Map isn’t making sense. More technical details might help you place the User Story in a better position in the Story Map.

The Evolution of Six Sigma: Continuous Improvement Using Network Analysis

Traditional process improvement techniques like Six Sigma, Lean and Kaizen have enabled the successful transformation of innumerable companies over the last few decades.

Even though they are based on a scientific approach to improve processes and increase the quality of the output, their relevance has decreased considerably. In fact, as effective as they were in the past, they are critically flawed for delivering the same impactful change moving forward without additional, new solutions.

The Need for Faster and More Integrated

Our world has changed radically since the beginning of the century. All elements of the modern enterprise are highly dynamic, complex and require high speed. Companies nowadays rely on elaborate processes, driven by global networks that provide resources, skills, and inputs to satisfy the demand of audiences dispersed around the globe. Take for instance, bringing to market a smartphone. For a smartphone to meet minimum consumer standards, the solution must have a tight integration between its operating system, hardware, software, user communities, etc. Each of these components is created by distributed networks, who must find a way to integrate seamlessly in the eyes of the customer. It is no longer feasible to consider each area independently and expect a major improvement in overall performance if changed.

In contrast, conventional process improvement techniques typically work well when things are relatively stable and are localized (say a manufacturing plant), but react very slowly in more dynamic environments (say integrating Uber Eats’ supply chain). Each technique – control charts, process mappings, etc. – was designed to analyze a specific, localized area and maximize its efficiency. So, if you have a product that interfaces with the market, the implementation of concurrent, independent process improvements may not converge.

An Emerging Science: What is Network-Based Process Analytics?

Network analytics arose from the perspective that organizations work around issues, tasks, and activities – not processes or organizational charts. Thus, the basic building blocks of an organization’s effectiveness are individual, day-to-day interactions between people. These interactions happen within networks of decision and influence, large and small, operating within teams, between departments, and across the entire company, even across partner companies. These networks tend to take on a life of their own – and often they have little to do with the formal organizational structure and, in many cases even the documented processes.

kreidler 062117 1An easy way to understand network analysis is to realize that organizations work just like the human brain. If neurons do not connect effectively, then your brain will spend more effort to perform a given task. Similarly, if people (the organization’s neurons) are not integrated properly, the result is inefficient processes and lower than optimal organizational performance.

A solid Network Analysis methodology provides a structured approach for achieving performance uplift. It should give management visibility to understand fundamental elements in an organization to make meaningful changes:

  • Communication networks: Examines the flow of information across the organization in the processes under study
  • Influence networks: How individuals influence decisions and activities within the organization. It provides visibility of the influence level of each stakeholder in the process
  • Decision networks: Studies the networks that drive core decisions. This proves the misconception that it is the CEO or the Big Boss have the final word in day to day decisions

Advertisement

Rethinking Process Engineering

Process improvement methodologies identify waste (or non-value add) and value add activities. The idea is to stop activities that are a waste and redeploy those resources toward activities that produce value. Thus, to be effective, tools must quickly identify, diagnose, design and synthesize processes in situations with a high order of complexity.

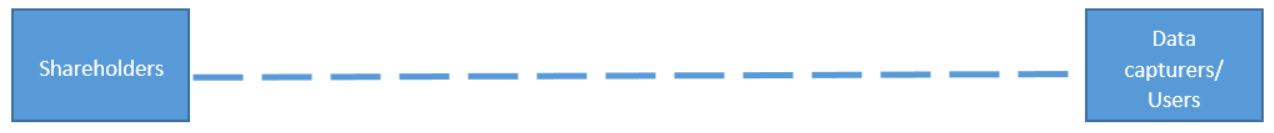
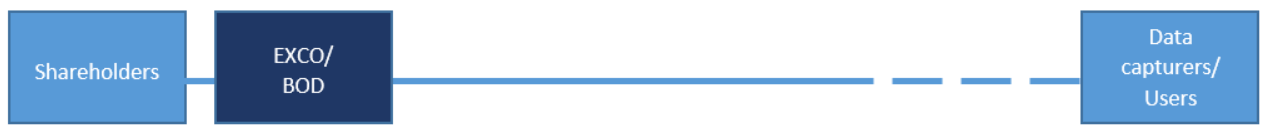
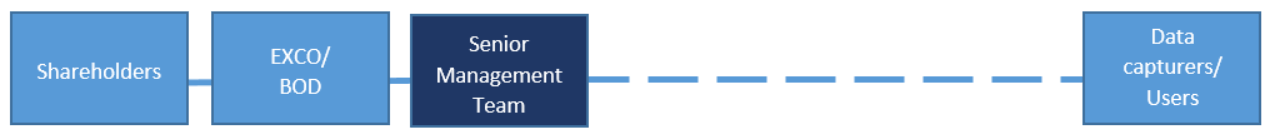
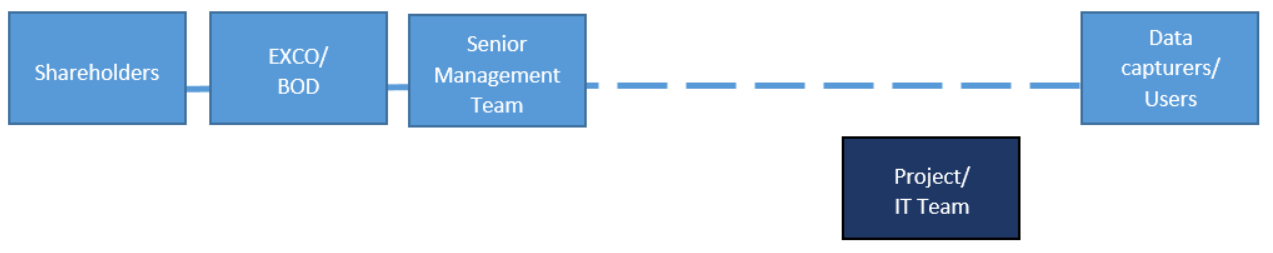
The traditional way to look at a company is through the lens of the organizational chart, with its hierarchies, “dotted lines” and other forms of structure but is this the way people perform their work?

According to Dr. Michael Mann, “An organization that is thought to operate in accordance with its formal org chart – DOESN’T.” This is because enterprises are dynamic and organize around tasks, not charts. Also, when performing tasks people will gravitate toward the path of least resistance, not what is most efficient and productive for the company. Therefore, if we are going to make enterprise-wide improvements, we must recognize that processes, tasks, and people are highly dynamic.

Network Analytics are Organizational MRIs

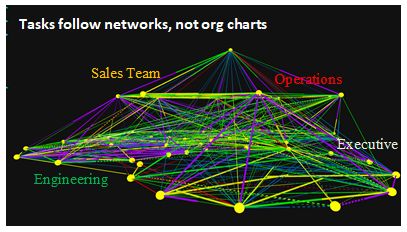
Network analytics is the equivalent of taking an MRI inside the organization: you need accurate instruments and the ability to interpret their results. Let’s explore a few scenarios to understand how processes can be improved drastically through the aid of such tools. The processes below are examples captured using Argonaut™, a leading organizational network analytics tool. In these examples, the 3D diagrams, lines show actual interactions between people in an organization, their frequency (thickness) and the perceived importance associated with such interactions (color). You will also notice that in several instances, a line leaves a node with a specific thickness and a color, but connects to a different node in a different thickness or color. This is a documented disagreement between stakeholders and therefore a sign of process pathology.

All Interactionskreidler 062117 T1 
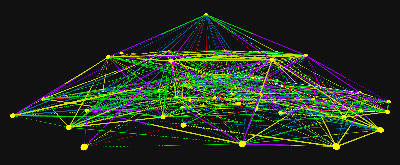
Enterprise processes can be very complex.  Interactions between consequential stakeholders vary in frequency, importance and agreement levels. There is organizational noise; deeper analysis is required to understand the opportunities for improvement.
High-Frequency, High-Importance – Disagreedkreidler 062117 T2 
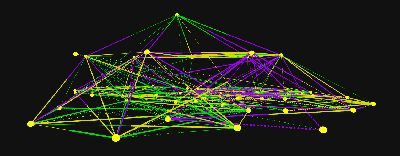
High Frequency, High Importance disagreements display areas that require attention. High Frequency and Importance typically means that at least one party is spending significant effort to push a task forward. When this is not reciprocated, it yields waste.
High-Frequency, High-Importance – Agreedkreidler 062117 T3 
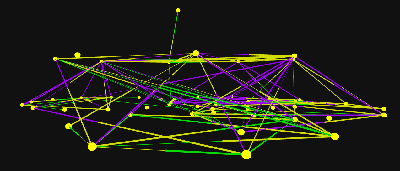
High Frequency, High Importance agreements are the tasks that everybody agrees makes the organization move forward. In a restructuring, these are the key areas that must remain undisturbed.
High-Frequency Low-Importance – Agreedkreidler 062117 T4 
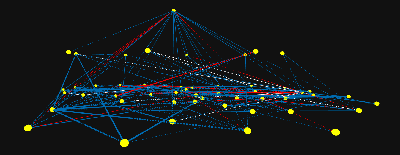
Agreed Low Important interactions are in brief, misallocated efforts. Everybody agrees that such tasks do not add significant value, but are done following an empty process ritual. Stop doing them, especially the ones with High Frequency.
Emergence View™:  Identifying influencers and decisions makerskreidler 062117 T5 
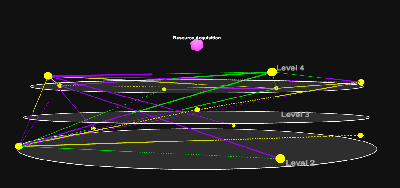
In a network Emergence View, what “emerges” at higher levels are the real decision makers and their degree of influence, regardless of organizational rank. These are the people who get the job done (or not!) as nominated by their peers.

As-Is, Should-Be, As-Of

The application of network analysis should not be a one-time shot. An “As-Is” study performed at the beginning and allows management to understand the current state and therefore gain an order of magnitude estimate for required changes. This should be complemented with a “Should-be” assessment by stakeholders based on their unique perspective in the organization. The target state is a negotiated agreement that takes the As-Is and the Should-Be.

“As-of” analyses provide an objective state of the processes under study as of a given date and allows you to objectively measure progress. As-of’s are performed throughout the life of change process to ensure that the organization is making progress as planned. In addition to being a very effective tool to monitor the pace of change, it allows management to correlate improvements in company processes with the desired outcomes.

Key Benefits of Using Network Analysis in Process Improvement

In a fast-changing business environment, we need to look for new tools to make process improvement effective. Network analysis is becoming a key component of organizational process management in the 21st century as it blends processes, people, and their interrelations. Understanding and addressing such complexities can improve speed to market, innovation and turn monolithic processes into major organizational weapons. As important, it helps to ensure that any network analysis goes beyond the superficial “social network” and connects the true interactions that result in actions taken by company personnel and other decisions regarding resource allocation.

Process improvements will result in the following three areas:

  1. Alignment to the Business. Are processes typically aligned to where the largest payoffs would be? The reality is that most process improvements methods do not even think about creating a repeatable link to creating business value. Network analysis can provide management with continuous visibility to identify where the largest payoffs will be – and monitor their progress. As shown above, management can perform an “MRI” of consequential organizational processes and visually identify the areas that need the most attention. As important, a broader study would also point out if the support systems are performing their function aligned to the key business drivers. 
  2. Recognize invisible connections with external processes. Enterprise processes are highly interactive and connected. They are dynamic and have interdependent interfaces. This is, if you make changes to a process, it will have a cascading effect on other processes, typically causing disruptions. Network analysis allows you to look at the system holistically: identify the process you are planning to improve, and it will tell you what the areas in the company that you need change at the same time are. You will get this information FAST without weeks of endless classic process mapping and stakeholder interviews.
  3. Anticipate outcome before all changes are implemented. Network analysis gives you a simple tool to monitor the process of change, and therefore you can make near-time interventions. By identifying the links that need to be created, changed or decommissioned, you can create a specific change plan and monitor how each change affects the outcome. This is a fundamental departure from classic process improvement initiatives. By employing techniques such as As-is, Should-be, and As-of, you monitor the process change, not the end state of change, thereby giving management ample opportunities to make tactical course corrections as needed.

About the Authors

mmannDr. Mann is the Chairman of Creso Global, an international consulting practice applying the latest insights from neuroscience, behavioral economics, and best-practice project management. He has served as an advisor to corporations and government agencies around the globe, including the United Nations; as the CEO of a diversified high technology company with industrial, commercial, service, and aerospace business units; as the founder of successful engineering, manufacturing, and service arms; as an outside director of both public and closely held high technology and health services companies; as a member of the Board of Examiners of the Malcolm Baldrige National Quality Award; and on the Army Science Board, where he chaired the Directed Energy and Ballistic Missile Defense panels. Email: [email protected]

ekreidlerErich Kreidler, Managing Partner of KRE Consulting, has more than two decades of organizational consulting, management, and leadership experience. Erich, who heads KRE’s Project Management and Operations practice, is recognized for his expertise and experience in integrating complex organizations to generate optimal results; helping organizations scale for rapid growth; and the development of responsible and responsive crisis management processes. Kreidler lectures at USC’s Viterbi School of Engineering at the graduate level and has also served as a panelist, moderator and keynote speaker for several industry conferences and summits. Erich is also a founding member
and president-emeritus of the Institute of Industrial Engineers, Orange County, California Chapter. Email: [email protected]

Big Picture Thinking: Where Does the Business Analyst Fit In?

Recently my manager and I were having an in-depth discussion about the different levels of a Business Analyst (BA).

How do you figure out a BA to be junior, intermediate, senior and in some cases, principal/lead? Surely an analyst’s thought process and ability to understand plays a critical role when defining what level that BA is at.

During the discussion, we went to a boardroom, where my manager drew to circles on either end of a white board with a dotted line in between. On one side he wrote ‘shareholders’ and on the other, he wrote ’data captures.’ He then asked me to fill in the dotted lines with how the data captures affect the shareholders and show him where the BA fit between the two sides. The ability for you as a Business Analyst to build an end-to-end picture in your mind of the business you service will directly show in the detail and quality of the output you provide as a Business Analyst.

In this article, I fill in the blanks and show you what else fills in the ‘moonshot’ as I call it.

APPROVED Graphic1 1

Data captures in business are, generally, at the very end of the organization’s value chain, while shareholders, on the other hand, are those who have their money (value) in the game. How does a business give the shareholders more value? Generally through innovation, process improvements and doing things better.

Thus a board of directors (BOD) or executive committee (EXCO) will decide on the best strategy to increase value for their shareholders. In this article, we can assume that the executive committee has decided to offer a product via a mechanism that has given them an excellent reputation in the market, which would differentiate themselves from their competitors; make it easier for customers and reduce operational costs.

APPROVED Graphic2

EXCO or the BOD have communicated this strategy to the senior management team in the organization and have made it a high priority as they believe this will allow them to attract a big percentage of the target market.

APPROVED Graphic3

With the senior management team, EXCO has determined that to achieve their strategic objective, a mechanism in the business has to be rebuilt. EXCO and the senior management team then pull in the projects/IT team to help achieve this objective.

APPROVED Graphic4

EXCO, senior management and the Projects/IT team defines the objective; the business owner of the project; the stakeholders; the scope, and the deliverables required by the project/IT team.

Furthermore, SME’s and specific employees are identified to ensure the rebuilding process delivers the relevant functionality.

APPROVED Graphic5

You might ask, why is the projects/IT team out of line and where is the BA? The BA falls between the strategy and the users. I say it in this manner because the BA has to know why a project is being initiated and ensure the deliverables of the project/IT team align to the users/employees who will be directly affected.

APPROVED Graphic6 1

The BA should understand the strategy; the purpose; the moonshot or the reason as to why a project has been initiated. Yes, some stakeholders will push their agenda, but it lies upon the BA to filter/manage requirements/instructions and ensure the project/IT team deliver according to the strategy/purpose of the project. The BA has to align the requirements of the end users to the strategy of the business and communicate this back to the project/IT team for them to deliver.

APPROVED Graphic7

The better you understand requirements about the strategy/moonshot, the more value you can provide. You can challenge certain requirements/changes, or you can propose requirements/changes that better align to the users need and strategy of the project. You can better determine solutions or realize requirements missed by the end user, thus ensuring a more accurate deliverable by the project/ IT team.

Producing a deliverable that does not align with the strategy or provide value to an end user can directly result in zero value for business and zero value for shareholders. Thus move away from being a note taker and move towards becoming a Business Analyst!