
Points Make Problems
Points Make Problems (Rather Than Prizes) – Or why Story Points might not be the best way of estimating effort.
Points Make Problems (Rather Than Prizes) – Or why Story Points might not be the best way of estimating effort.

Arguably, systems built within the information technology industry have reached a certain level of maturity since their birth about 60 years ago. Whether that maturity could be characterized as adolescence or middle-age is up for discussion.
Whatever the age level, we do know that there are myriads of solutions in the marketplace that satisfy many of the information management needs in many industries. It is therefore imperative that any business in today’s marketplaces approach their quest for IT solutions in a methodical manner.
SaaS or “Software as a Service” is the clarion call of IT applications today. This type of solution is owned, delivered and managed remotely by the providers themselves. It offers many advantages over providing purchased or in-house developed solutions deployed on-premise. including [1]
Therefore, no matter at which level a solution exists in the model outlined herein, it is essential to consider whether it is a SaaS solution or not. It may even be prudent to opt for a SaaS or cloud-based solution that is at a lower level in the model presented below, if one at a higher level can only be deployed on-premise.
Enterprise Information Systems (EIS) exist for every major industry. EIS’s are also known as enterprise resource planning (ERP), core, or enterprise application (EA) systems. Identifying the one that matches the majority of our business needs is crucial. Finding a system that is just the right mix of the following characteristics is the key:
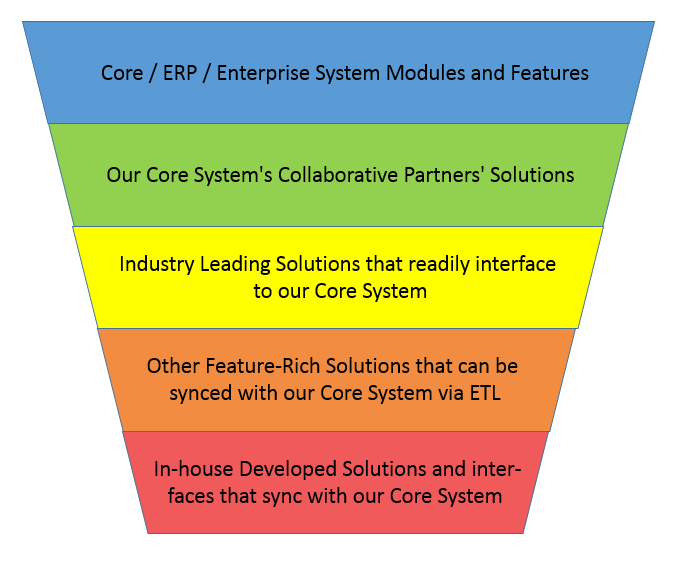
The right EIS will go a long way in satisfying an organization’s business processing needs. However, every EIS has its limits.
Quality leading industry solution providers will not only have an EIS solution to accommodate many of the business processing needs of that industry, but they will have formed key, collaborative relationships with partner IT solution companies to help them deliver an even broader suite of solutions to their customers.
These partner-provided systems will be the next source for satisfying additional processing needs. The best systems will come from collaborative partners
An EIS vendor can only see so much of the business needs landscape that surrounds the industry for which their EIS is a solution. They will usually partner with other vendors whose solutions fit well within a broad spectrum of their customer base.
So when a line of business needs a technology solution that neither our EIS vendor nor any of its partners can provide, there are usually other vendors we can turn to. Fortunately, many of these solution providers have developed systems with a modern and mature application programming interface (API) and an associated data transport mechanism like an API gateway, messaging bus, Electronic Data Interchange (EDI), or an eXtensible Markup Language (XML) transport protocol such as Simple Object Access Protocol (SOAP) or REpresentational State Transfer (REST).
If no solutions for the niche need have a mature API, then we should next turn to vendor-provided applications that deliver the necessary requirements and desired features, and can handle some type of mass-updating or bulk-loading of data into and out of their system. This kind of integration is commonly known as an Extract-Transform-and-Load (ETL) method of synchronizing two disparate systems.
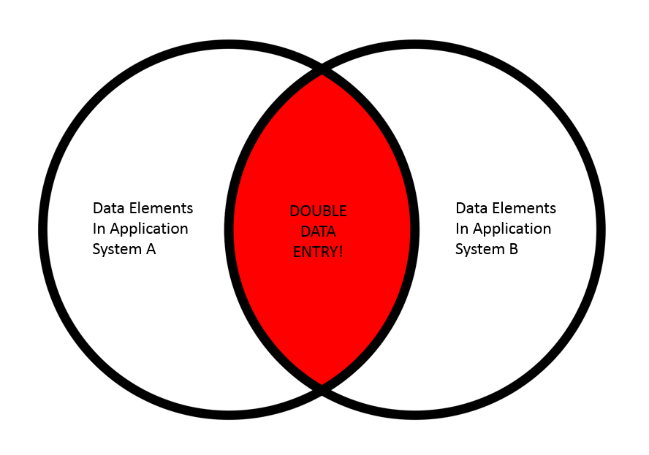
There are very few systems that handle an island of data that has no relation to any other system within the bank. This means that where the data in a niche system overlaps with other existing systems, by necessity we will have a double data entry condition. This should be avoided at all cost!
Inevitably, we will come across business processes that are unique to the way we want to provide our services. If a thorough market search – including reaching out to peers in our lines of businesses to see how they may accommodate similar business-delivery desires – renders no existing technology solutions for these “uniques,” then two questions must still be asked:
Only when both questions are answered affirmatively can we proceed at this Level. And even then, with caution!
A business analysts, our goal is to try to be as objective as possible when suggesting or providing technology solutions to our employers or clients. Our sponsors or stakeholders often, however, come into system selection initiative all fired up about System XYZ that a peer has told them about or that they saw demonstrated in some venue – and they just have to have it! Taking a structured approach like the one discussed above is always a best practice. We want the best solution, the one that will help move the organization forward to even greater success.
[1] “Why SaaS? 7 Benefits of Cloud vs. On-Premise Software,” Mandy Movahhed, June 18, 2014, https://www.handshake.com/blog/why-saas-cloud-benefits-vs-on-premise-software/
[2] “The ROI of Software-As-A-Service,” Liz Herbert and Jon Erickson, July 13, 2009, http://resources.idgenterprise.com/original/AST-0113124_forrester_roi_of_saas_1_.pdf

Talking to some younger BA colleagues recently, it came as something of a surprise that they didn’t know what an Entity Relationship Diagram was.
While people may associate them with data geeks and the detail of database design (where they’re certainly pretty useful) I’ve mainly used them in business contexts, where they’ve been equally useful in various ways.
What Is An Entity Relationship Diagram?
An ERD, or Entity Relationship Model as they’re also described, allows us to model an organisation’s data. That’s not just the physical data within the various applications and their databases, but high-level business data, even at enterprise level. That’s also known as ‘logical’ data.
To understand what that is, imagine going for a walk in a country location and using a paper map. The map shows you paths, landmarks and other information but it doesn’t tell you that a path is muddy or there are cows in the field you’re crossing. The map is simply a representation of the terrain you’re walking across. Likewise, an ERD is a pictorial representation of an organisation’s data, which can be used as a map to guide people through that organisation.
A data entity is simply something that describes data attributes that are connected in some way. Thinking about you as an individual, your data entity could include:
There could be linked entities for your family – parents, partners, siblings and children. There would be entities describing the jobs you’ve held, educational establishments you attended and addresses you lived at.
ERD as a Business Tool
The entities above would typically be part of a job application or HR system so, if you were designing such a system, an ERD would be a good place to start doing this. And you can show that picture to the various stakeholders who’ll be using the system, be they in the HR team, hiring managers or even managers with no hiring responsibilities.
I worked for an Insurance company that was undergoing a major transformation and we used ERD’s for each business area, validating them with all senior managers in the company, not just those within the business area. That gave us a 360-degree view of potential data requirements, which often threw up insights from those outside the immediate business area who might use that data.
An example of that would be Claims staff wanting to see Underwriting data, so they could assess whether a particular risk was covered together with any conditions associated with the cover. Being able to identify that data easily was really important to them. Admin managers might need to understand resource requirements using various criteria, that an Underwriting manager might not be the slightest bit interested in. ERD’s were a great way to underpin those discussions and we got many useful insights that we might not have got otherwise.
Of course, you can (and should) use an ERD to also drive the design of a database or data warehouse, and that applies even at a business level (rather than a detailed technical level). An example of that involved an Investment Management company who wanted to build a Data Warehouse to better analyse client data. The problem was, they couldn’t really pin down their requirements accurately enough for the 3rd-party supplier who would be building it. I got involved and sat down with the key user to build a high-level ERD covering the scope of the specific business area.
That forced them to think about what data they wanted and how it all fitted their key business reporting requirements. We then expanded the model to include the business attributes of the data, splitting those out into measures (items we wished to quantify) and dimensions (the lines along which we wished to analyse them). So a measure might be commission charged and a dimension might be client or security type. We then tracked those business data items into the application database to build the agreed data items and reports.
ERD’s and Data Definitions
This drove other discussions such as “What do you mean by commission?” The investment manager would charge their clients a commission depending on the size of the fund managed. This was often shared with other professional advisers connected to that client. So, did “Commission” mean gross commission received, the net after sharing?
The ERD proved to be the common interface between the client’s business-facing and technical staff, who normally spoke completely different languages. That enabled us to extract the correct data and report it accurately. It gave us a traceability matrix, from high-level entities down to physical database fields, and the project was a huge success.
But it doesn’t just apply to data warehouse design. All organisations will require some level of management reporting and it’s crucial to understand what users want and how you can deliver that. Another project involved a CEO complaining he got inconsistent figures for a key measure, depending on which business area he asked. By producing a high-level ERD, and defining data pictorially, I was able to highlight the various different and inconsistent interpretations of the key measures. This meant that they could ensure definitions were consistent across the organisation, or that necessary differences were clearly documented and understood.
Summary
You don’t need to go to the level of defining things like optionality, foreign keys or Third Normal Form in an ERD. It can be as simple as named entities (without their data attributes) and the basic relationships between them. That alone can be a powerful visual tool for understanding an organisation. ERD’s should be used to define your data architecture, setting data standards and highlighting issues around data duplication and quality.
If you want to take your ERD further, maybe for application/database design, that high-level view is a great place to start. You don’t have to be a data scientist to produce an ERD; any competent BA should be able to do it.
Where ERD’s become incredibly powerful is when they’re combined with processes. But that’s a separate article entirely.
About me
A Business Analyst with 35 years’ experience, across various sectors but mainly in Financial Services. I’ve worked on a number of strategic transformation programmes and have particular experience in data-driven projects involving Business Intelligence/MI/Data Warehouse design. Currently working as a UK Central Government employee on a major Payments transformation programme.

As we know, the Johari window was created by leading psychologists in 1955 as a technique to help people develop a better grip on their relationships with themselves and others.
The concept is simple and intuitive & this article attempts at narrating the view through the eyes of a high performing project Business Analyst/Consultant. The author is inspired by the overarching Blue Ocean Strategy Philosophy of applying learnings from across domains to create unique perspectives; in this instance a classic psychology tool is taken up in fresh Business analysis & consulting domain.
The objective is to trigger unprecedented research and appreciation that can be developed to a powerful perspective tool in the leadership journey of a consulting practitioner. At the least the view will help develop a constructive & compassionate perspective to acknowledge the known and an appreciative curiosity to respect the unknown!
The Johari Kaleidoscope opens to four dimensions:-
It is worthwhile to note that this view, like that through a Kaleidoscope, constantly changes with requirements shifting between the four quadrants throughout the life cycle of the project! At times it is the Business consultant/analyst’s conscious attempts that shift the quadrants (e.g. a robust stakeholder interview unravels an unstated need and moves it from quadrant 2 to 1!) & sometimes the shift happens through factors beyond the control of project/BA. (E.g. /project decides to drop a requirement but it is yet to be socialised with key stakeholder, a shift from quadrant 1 to hidden quadrant 3)
Let us now dive deeper into interesting insights derived out of the four quadrants,
Quadrant 1 is the “visible to all “quadrant containing entities–that are freely and openly available for verification to the project as well its stakeholders. It is expected that this quadrant will manage 80-90% of requirements in the peak phase. In other words, this quadrant initially exposes just a bit of the whole truth to the curious BA! A Business Consultant starts the journey of acknowledging the knowns and appreciating the unknowns at this juncture.
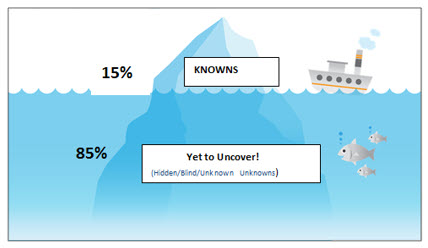
Diagram1
While this may sound the easiest quadrant of requirements for a Consultant to deal with, the quadrant poses its own unique challenges/expectations:-
In my view this is the “thinking” quadrant for the consultant! This quadrant has aspects not known to the consultant//project but known to the world/stakeholders. During structured and unstructured elicitation, the Business Consultant has to uncover these unstated requirements and shift them to quadrant 1 to manage them effectively. Fortunately there are tools and techniques available to help deal with this:-
This is a technique widely used in Organisation research consulting paradigms, and in my view, a perfect tool for a Business Consultant to unravel facts and requirements, not so apparent to the naked eye! In short terms Appreciative Inquiry or better known as “AI”, is to weave in conversations that focus on strengths ( not weakness) and possibility thinking( not problem thinking) that travels through the 4-D cycle – Discover, Dream, Design and Destiny. The key trait in this approach is consultative collaboration and imaginative exploration that helps shift the aspects yet unknown to the Business Consultant from quadrant 2 towards more manageable quadrant1.
Collaborative game is a technique inspired by game play for the adept facilitator BA, as part of the elicitation activity, to collaborate in building a joint understanding of a problem or a solution. The BMC is a visual depiction of enterprise value creation (how value is created, delivered and captured). A combination of these two techniques could help the enterprise Business Consultant to accentuate the spirit of consultation, collaboration and co-creation required to uncover treasures (aka requirements, facts) in other quadrants(quadrants 2,3 and 4) and shift to quadrant 1 and baseline .
These Techniques present favourable group dynamics whereby astute consultant extracts information by opening hitherto closed mind doors (Elicitation) and also dig within and reveal information of interest to the stakeholders (Excavation). Together the group explores aspects yet unknown to both project and stakeholders and discovers items to be shifted to quadrant 1. (Exploration). Once the requirements /facts are brought over to quadrant 1 the Business Consultant establishes alignment and baseline such information. (Establish)
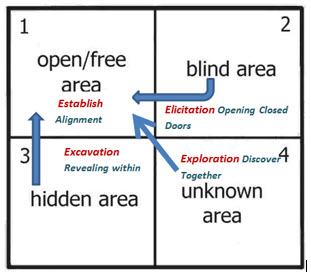
Diagram2 Note: Above 4E- model (Elicitation, Excavation, Exploration and Establish) is purely author’s hypothesis framework built over Johari window and not traced to any available research. Interested researchers feel free to extend my framework; appreciate siting this original article reference though.
These techniques are applicable to below quadrants as well. At the end of an engaging workshop deploying such techniques it is not unusual that quadrants 2/3/4 shrink as the outlets depicted above floods qudrant1
Quadrant 3 is the “Challenge “quadrant in many aspects. This quadrant contains information /requirements (stated/unstated), risks, challenges, assumptions etc. known to the consultant/project but not yet revealed to the world/stakeholders deliberately or unknowingly. The “Challenge” comes from the extreme demand of Mindfulness and Integrity from Business Consultant to differentiate between the two scenarios and act accordingly. While project confidential or trivial information need not be released to wider audience, a crucial decision regarding a stakeholder requirement could be inadvertently held back!
As an example consider project prioritisation of elicited requirements from various stakeholders. A requirement from a stakeholder group has been down prioritised and might not be met. This decision has not been communicated to the stakeholder group timely through proper re-engagement. This “hidden” project decision could be catastrophic down the line for the project to meet timely deliverable sign-offs & quality acceptance criteria.
While Organizational culture and working atmosphere is of utmost significance to create a culture of “shared wisdom ” – a Business consultant’s proactive leadership can reduce the pile of information /requirement/risks that are wrongly kept in quadrant 3 & must be shifted to quadrant 1 for wider audience reference. A Business Consultant can assist the project in reducing such “incongruence” and help “breaking bad news at right time in proper manner” to audience through various techniques and behaviours. The example below touches upon the example covered in previous paragraph.
As depicted in Diagram2 the purpose of the shift from Quadrant 3 to Quadrant 1 is to Establish Alignment.
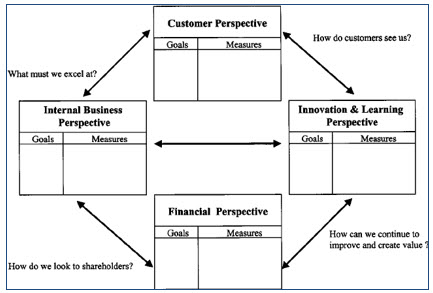
The Balance Score Card (originated by Robert Kaplan and David Norton), in my view, is the perfect tool for depicting the broader context and balance considerations under which the requirement has been down prioritised. Based on the project context the standard Score card parameters can be tweaked to communicate Key project vision, goals and requirement prioritisation dimensions. The standard BSC dimensions are as below:-
As a Blue ocean strategy practitioner, I am committed to looking at protocols and frameworks from unexpected sectors of the world that bring fresh perspectives to Business analysis consulting paradigm!
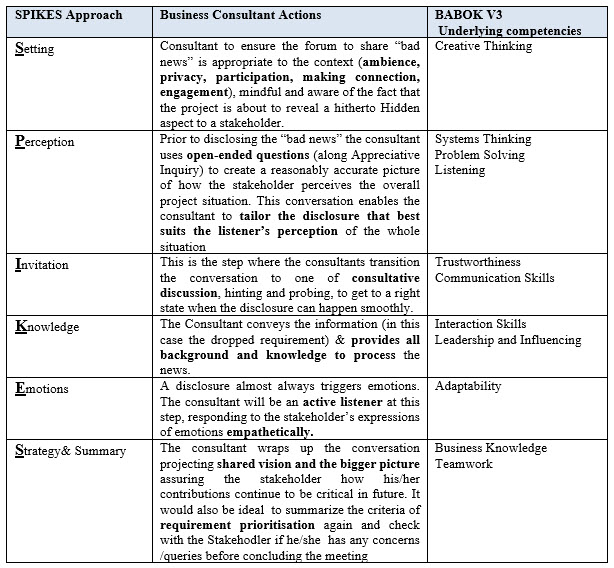
The SPIKE protocol, as you know, is used by clinical practitioners (e.g. Cancer Australia) – to disclose a bad news to the patient regarding their medical condition. The first reason the protocol is referred is it’s through structured patient“(in our case stakeholder) centric approach. The other compelling reason is the extreme learning aspect .When it comes to braking bad news, it doesn’t get more complex/stressful than the situation where a medical practitioner (in our case the consultant) has to disclose extreme information to a patient in distress (in our case the stakeholder whose requirement has been dropped). The analogy used is – If you learn how to climb the Himalayas, there is a fair chance you are well equipped to climb any other mountain in the world.
Let us look at how the SPIKE protocol can be interpreted to meet the management Consultant perspective & map into a few of the underlying competencies mentioned in BABOK V3:-
Quadrant 4 is the “Mystery “quadrant and hence the Quadrant of “Exploration” and “Innovation”. Research shows less than 10% of projects tap into this quadrant effectively through the life cycle of the project for various reasons! One major reason is the lack of acknowledgement of the very fact that such a quadrant exists; i.e. there is no conscious effort from project or stakeholders to look beyond the obvious and they often end up scrambling repeatedly over the knowns. But for the brave few who venture out on the exploration, challenging the “stated” and “statuesque “ – invaluable treasures await! – such critical information that could make the difference between a good launch with a few glitches & average customer experience vs a great implementation with zero defects and 100% customer satisfaction! . This is the quadrant to challenge the knowns and statuesque to breakthrough to innovative paradigm shift information!
A few consulting tools and techniques that I have come across aiding this collaborative ‘exploration “is listed below (in addition to the”Collaborativee games” & BMC (Business Model Canvasing) listed in previous section):-
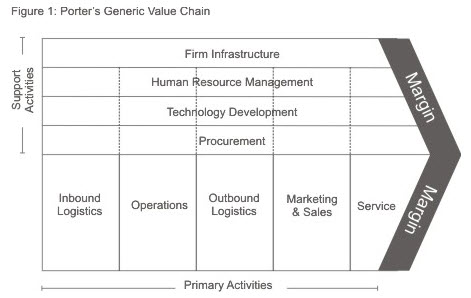
Example provided here is classic Porter’s model. Any value chain analysis is aimed at appreciating the scope of the project in the context of overall Organisational value levers and dependencies. It is often found that such an end-end view based deliberation results in fresh perspectives that ultimately unravel crucial dependencies or information enriching the requirements.
As we know the term emerged at Stanford in the 1980s, as a way to characterize the broad approach taken toward problem solving. This user centric approach, originating in the world of design, embraces visual thinking. Design thinking can be applied to the world of business consulting, along with stakeholders, to solve problems in processes, business models and strategy. The key idea here is to push the thinking beyond the comfort zones and invent and imagine customer experiences /requirements from Quadrant 4 and move to them to reality in quadrant 1. The Design Thinking stages are:-
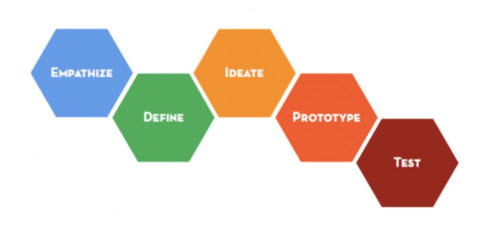
Note: Above model is attributed to Tim Brown (CEO and president of IDEO)

What is your title? Is it the same as your professional identity?
The flexibility of Business Analyst roles tend to vary from organization to organization. It is nothing new that Business Analysts tend to wear many hats. Often, when transitioning from a place of expertise in varying industry roles, Business Analysts are given advice to be open to the many organizational directions. Acrobatics become one of the first training lessons, as Business Analysts navigate dynamics, priorities, relationships and cross-team goals.
It is no wonder that Business Analysis is related to a “wild card” role.
The many titles and hats that Business Analysts wear can be confusing when navigating conflicting interests and priorities within an organization. Loyalty and personal history can be a topic of question, especially if the Business Analyst’s professional history has been deep-rooted in a previous specific area.
Breaking down assumptions and supporting reinvention becomes part of personal branding and professional identity. This can be dangerous when eliciting requirements, as stakeholders may have preconceived notions or implicit bias on your approach from misplaced assumptions or even your time in previous departments.
How does one find neutrality in a world that yearns for categorization?
Does your organization see you as an analyst or an influencer?
If you can flex your true “wild card” self, you may demonstrate the abilities as both, and be known as a truly effective catalyst of change.
In a professional landscape drenched in the demand of professional project management, where does the Business Analyst exist? The answer is everywhere, and anywhere!
Business Analysts in many cases have varying degrees of responsibility, leadership and influence. They may be the leaders of your initiative, gather requirements, specify requirements, train, implement or coordinate your most pertinent projects. In true wild card form though, they must be strategically included and value-considered. Including them early on and then not continuously can lead to confused team direction, responsibility and coordination. Alternatively, not including them until the very end can limit their involvement in helping to attain the optimal design option and execution.
Approaches to stakeholder engagement can blaze the path to define personal approaches. Personal connections can either limit or leverage your style. Be conscious of your conduct, influence and personal promotions in your organization, as they very much set the tone for where stakeholders suspect your personal interest may rest.
If you do not have a professional network that offers a mutually-beneficial environment, create one. This should be transactional in nature and offer an exchange of ideas, priorities, interests and concerns. These stakeholders are important to your own expertise and context, as you place yourself within projects, focus and organizational priorities.
That is not to say that the only valuable stakeholder is one with high influence. Listening to stakeholders that shoulder the day-to-day of operations can offer valuable insight to where initiatives involving efficiencies are best directed. When considering benchmarking efforts, listen to these voices that offer specifics, knowing that your own interest tends to consider that devil in the details!
Utilizing efficiency in Business Analysis means accepting the varying contributions they bring to the table. If your organization does not specify the title of “Business Analyst”, consider those that carry the torch to provide the same function – they could be right outside your office door, already leading a herd of stakeholders that support your initiative.
If they do exist in title, consider the careful approaches they take to analyze impacts and create win/win scenarios. These are not easy positions or conversations, and the approach to effective change could exist within a current working and well-developed camouflage! Bridging worlds means understanding them, and Business Analysts have some of the best tools to construct those avenues of travel across dynamic professional worlds.
Professional development is quick to encourage the creation of up-and-comers for already-defined positions and identities. Do not be discouraged when someone asks you what the next step is and you have trouble articulating it in title but not description. If you can describe what you strive for, you are feeding your professional identity and development. Find a way to incorporate your own model within an existing title with a brand new approach. Forging new paths forward is the very root of innovation. The BABOK even self-defines as a “guide”. Standards do not require narrow lines of the same method. In essence, there is no single formula – and creativity and change often thrive without those restrictions.
In a world with a revolving door-appetite of titles and qualifications, it is always useful to regularly scan your environment for your biggest agents of victory.
You may already be holding the best card in the deck.