Tag: BPM

The Evolution of Six Sigma: Continuous Improvement Using Network Analysis

Traditional process improvement techniques like Six Sigma, Lean and Kaizen have enabled the successful transformation of innumerable companies over the last few decades.

Even though they are based on a scientific approach to improve processes and increase the quality of the output, their relevance has decreased considerably. In fact, as effective as they were in the past, they are critically flawed for delivering the same impactful change moving forward without additional, new solutions.

The Need for Faster and More Integrated

Our world has changed radically since the beginning of the century. All elements of the modern enterprise are highly dynamic, complex and require high speed. Companies nowadays rely on elaborate processes, driven by global networks that provide resources, skills, and inputs to satisfy the demand of audiences dispersed around the globe. Take for instance, bringing to market a smartphone. For a smartphone to meet minimum consumer standards, the solution must have a tight integration between its operating system, hardware, software, user communities, etc. Each of these components is created by distributed networks, who must find a way to integrate seamlessly in the eyes of the customer. It is no longer feasible to consider each area independently and expect a major improvement in overall performance if changed.

In contrast, conventional process improvement techniques typically work well when things are relatively stable and are localized (say a manufacturing plant), but react very slowly in more dynamic environments (say integrating Uber Eats’ supply chain). Each technique – control charts, process mappings, etc. – was designed to analyze a specific, localized area and maximize its efficiency. So, if you have a product that interfaces with the market, the implementation of concurrent, independent process improvements may not converge.

An Emerging Science: What is Network-Based Process Analytics?

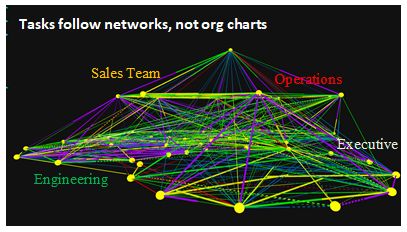
Network analytics arose from the perspective that organizations work around issues, tasks, and activities – not processes or organizational charts. Thus, the basic building blocks of an organization’s effectiveness are individual, day-to-day interactions between people. These interactions happen within networks of decision and influence, large and small, operating within teams, between departments, and across the entire company, even across partner companies. These networks tend to take on a life of their own – and often they have little to do with the formal organizational structure and, in many cases even the documented processes.
kreidler 062117 1An easy way to understand network analysis is to realize that organizations work just like the human brain. If neurons do not connect effectively, then your brain will spend more effort to perform a given task. Similarly, if people (the organization’s neurons) are not integrated properly, the result is inefficient processes and lower than optimal organizational performance.

A solid Network Analysis methodology provides a structured approach for achieving performance uplift. It should give management visibility to understand fundamental elements in an organization to make meaningful changes:

  • Communication networks: Examines the flow of information across the organization in the processes under study
  • Influence networks: How individuals influence decisions and activities within the organization. It provides visibility of the influence level of each stakeholder in the process
  • Decision networks: Studies the networks that drive core decisions. This proves the misconception that it is the CEO or the Big Boss have the final word in day to day decisions

Advertisement

Rethinking Process Engineering

Process improvement methodologies identify waste (or non-value add) and value add activities. The idea is to stop activities that are a waste and redeploy those resources toward activities that produce value. Thus, to be effective, tools must quickly identify, diagnose, design and synthesize processes in situations with a high order of complexity.

The traditional way to look at a company is through the lens of the organizational chart, with its hierarchies, “dotted lines” and other forms of structure but is this the way people perform their work?

According to Dr. Michael Mann, “An organization that is thought to operate in accordance with its formal org chart – DOESN’T.” This is because enterprises are dynamic and organize around tasks, not charts. Also, when performing tasks people will gravitate toward the path of least resistance, not what is most efficient and productive for the company. Therefore, if we are going to make enterprise-wide improvements, we must recognize that processes, tasks, and people are highly dynamic.

Network Analytics are Organizational MRIs

Network analytics is the equivalent of taking an MRI inside the organization: you need accurate instruments and the ability to interpret their results. Let’s explore a few scenarios to understand how processes can be improved drastically through the aid of such tools. The processes below are examples captured using Argonaut™, a leading organizational network analytics tool. In these examples, the 3D diagrams, lines show actual interactions between people in an organization, their frequency (thickness) and the perceived importance associated with such interactions (color). You will also notice that in several instances, a line leaves a node with a specific thickness and a color, but connects to a different node in a different thickness or color. This is a documented disagreement between stakeholders and therefore a sign of process pathology.

All Interactionskreidler 062117 T1 Enterprise processes can be very complex.  Interactions between consequential stakeholders vary in frequency, importance and agreement levels. There is organizational noise; deeper analysis is required to understand the opportunities for improvement.
High-Frequency, High-Importance – Disagreedkreidler 062117 T2 High Frequency, High Importance disagreements display areas that require attention. High Frequency and Importance typically means that at least one party is spending significant effort to push a task forward. When this is not reciprocated, it yields waste.
High-Frequency, High-Importance – Agreedkreidler 062117 T3 High Frequency, High Importance agreements are the tasks that everybody agrees makes the organization move forward. In a restructuring, these are the key areas that must remain undisturbed.
High-Frequency Low-Importance – Agreedkreidler 062117 T4 Agreed Low Important interactions are in brief, misallocated efforts. Everybody agrees that such tasks do not add significant value, but are done following an empty process ritual. Stop doing them, especially the ones with High Frequency.
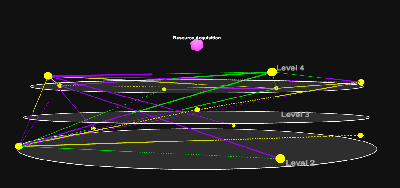
Emergence View™:  Identifying influencers and decisions makerskreidler 062117 T5 In a network Emergence View, what “emerges” at higher levels are the real decision makers and their degree of influence, regardless of organizational rank. These are the people who get the job done (or not!) as nominated by their peers.
As-Is, Should-Be, As-Of

The application of network analysis should not be a one-time shot. An “As-Is” study performed at the beginning and allows management to understand the current state and therefore gain an order of magnitude estimate for required changes. This should be complemented with a “Should-be” assessment by stakeholders based on their unique perspective in the organization. The target state is a negotiated agreement that takes the As-Is and the Should-Be.

“As-of” analyses provide an objective state of the processes under study as of a given date and allows you to objectively measure progress. As-of’s are performed throughout the life of change process to ensure that the organization is making progress as planned. In addition to being a very effective tool to monitor the pace of change, it allows management to correlate improvements in company processes with the desired outcomes.

Key Benefits of Using Network Analysis in Process Improvement

In a fast-changing business environment, we need to look for new tools to make process improvement effective. Network analysis is becoming a key component of organizational process management in the 21st century as it blends processes, people, and their interrelations. Understanding and addressing such complexities can improve speed to market, innovation and turn monolithic processes into major organizational weapons. As important, it helps to ensure that any network analysis goes beyond the superficial “social network” and connects the true interactions that result in actions taken by company personnel and other decisions regarding resource allocation.

Process improvements will result in the following three areas:

  1. Alignment to the Business. Are processes typically aligned to where the largest payoffs would be? The reality is that most process improvements methods do not even think about creating a repeatable link to creating business value. Network analysis can provide management with continuous visibility to identify where the largest payoffs will be – and monitor their progress. As shown above, management can perform an “MRI” of consequential organizational processes and visually identify the areas that need the most attention. As important, a broader study would also point out if the support systems are performing their function aligned to the key business drivers. 
  2. Recognize invisible connections with external processes. Enterprise processes are highly interactive and connected. They are dynamic and have interdependent interfaces. This is, if you make changes to a process, it will have a cascading effect on other processes, typically causing disruptions. Network analysis allows you to look at the system holistically: identify the process you are planning to improve, and it will tell you what the areas in the company that you need change at the same time are. You will get this information FAST without weeks of endless classic process mapping and stakeholder interviews.
  3. Anticipate outcome before all changes are implemented. Network analysis gives you a simple tool to monitor the process of change, and therefore you can make near-time interventions. By identifying the links that need to be created, changed or decommissioned, you can create a specific change plan and monitor how each change affects the outcome. This is a fundamental departure from classic process improvement initiatives. By employing techniques such as As-is, Should-be, and As-of, you monitor the process change, not the end state of change, thereby giving management ample opportunities to make tactical course corrections as needed.

About the Authors

mmannDr. Mann is the Chairman of Creso Global, an international consulting practice applying the latest insights from neuroscience, behavioral economics, and best-practice project management. He has served as an advisor to corporations and government agencies around the globe, including the United Nations; as the CEO of a diversified high technology company with industrial, commercial, service, and aerospace business units; as the founder of successful engineering, manufacturing, and service arms; as an outside director of both public and closely held high technology and health services companies; as a member of the Board of Examiners of the Malcolm Baldrige National Quality Award; and on the Army Science Board, where he chaired the Directed Energy and Ballistic Missile Defense panels. Email: [email protected]

ekreidlerErich Kreidler, Managing Partner of KRE Consulting, has more than two decades of organizational consulting, management, and leadership experience. Erich, who heads KRE’s Project Management and Operations practice, is recognized for his expertise and experience in integrating complex organizations to generate optimal results; helping organizations scale for rapid growth; and the development of responsible and responsive crisis management processes. Kreidler lectures at USC’s Viterbi School of Engineering at the graduate level and has also served as a panelist, moderator and keynote speaker for several industry conferences and summits. Erich is also a founding member
and president-emeritus of the Institute of Industrial Engineers, Orange County, California Chapter. Email: [email protected]

Customer Experience (CX) is the new black!

The customer journey is a great technique to improve the Customer Experience (CX).

“You’ve got to start with the customer experience and work back toward the technology, not the other way around.”
– Steve Jobs

The customer, not technology, must be the core of your strategy.

As customers are driving consumption in the digital age, it is necessary to understand that this shift in product or service delivery cannot happen successfully without keeping the customer in the forefront. I recently spoke with a previous colleague of mine who has helped his digital services team re-evaluate their position in service delivery. His opinion, they are now front line staff. Why? Well, who sits between them and the customer?


Advertisement

This way of thinking is imperative for all businesses to incorporate when designing any new or improved service delivery channel. The customer experience will determine whether a customer transacts or re-engages with a company. But how do we understand what impression the customer gets from the product and service delivery methods? Enter the Customer Journey.

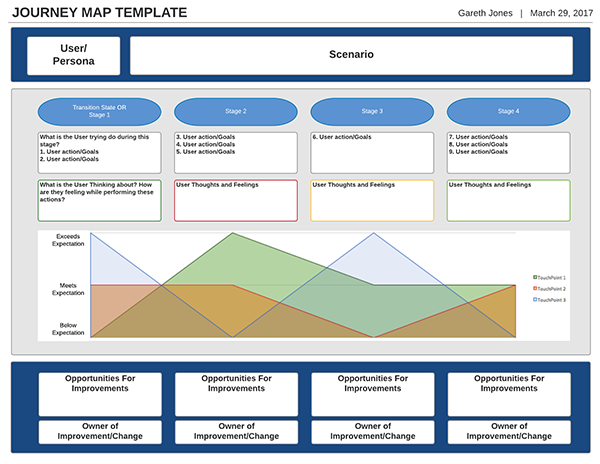
The Customer Journey Map is a visual representation of the customer’s experience across a company’s product and service lines. They are cross-functional in nature (ideally following the business value stream) and supported with data (something that is increasingly available and valuable in the digital age). They provide a sense of what the customer wants to achieve, and how effective the business is at enabling that desired outcome. This then enables the business to develop and deliver targeted initiatives to meet these customer needs.

jones 062717 1

Customers who have good experiences with a company are more likely to stay on as customers, increasing their total spend, and just as importantly, increasing the likelihood that they will pass on positive sentiments to other potential customers. A poor customer experience then increases the chances for the exact opposite.

The customer journey doesn’t just need to be externally focused. Internal processes have customers also. Onboarding new staff can be an expensive and frustrating experience. Ever turned up to a new job only to be told you have no place to set-up, and nothing to set-up anyway? What about when you request an asset via the on-line self-services portal? How often does this result in increased time trying to find a number to call, out of sheer frustration? Capturing this data and modeling these experiences will provide a greater context for the improvement ahead. By putting the customer at the forefront, the business can make the necessary changes to improve that experience and subsequently improve one of the first impressions a new employee has on their new employer.

It doesn’t matter if your business is implementing a new product or service or improving an existing one. Nor does it matter that your focus is internal, not external, the customer experience matters. Not focusing on this customer journey will reduce the likelihood of project and business success. Businesses exist to service customers, why would you look at it any other way?

How to Avoid Confrontations at the Office

Office politics may be more confusing and confrontational than nationwide politics.

Sure, there may not be as much at stake, but a terrible relationship between two employees can hurt the productivity and morale of an entire company.

So, how do you make sure that you’re not in the midst of one of these feuds and what can you do to ensure that your coworkers aren’t tied up in any negative relationships?

Examples in History

With all of the negative political discourse present in the modern era, it’s difficult to imagine leaders of two parties being good friends. But, Tip O’Neill and Ronald Reagan, the Democrat speaker of the house and Republican president, respectively, established a great relationship that led to increased productivity in Washington, D.C. How did they reach this point?

Tip and “the Gipper” were able to find common ground and get a lot done in terms of compromising and meeting halfway on legislation. They sought to find commonalities and embrace these similarities instead of focusing on and exploiting differences in their ideologies.

So, how do you use their example in your life at work? The answer is simple: avoid topics that can stir up the emotional pot. There used to be a simple rule for polite conversation: don’t talk about politics or religion.

Stick to the Basics

Until you know the lay of the land with regard to your coworkers’ political and religious views, tread lightly. Eventually, you’ll develop a rapport with certain employees, but don’t push the envelope. And, if anything ever gets contentious, or is heading down that road, ABORT. It’s always better to take the high road when it comes to office disagreements.

Try saying something like: “I get your point of view on this; I just would prefer to not talk about it here at work.” There’s nothing that someone can say to that! It’s easy and smart to hide behind the cover of “being at work.” Also, it’s easy to portray a middle-of-the-road viewpoint, regardless of what you actually think.

No one likes the person at work who thrusts his or her views upon everyone else. The world could use a little more compromising and pleasantry, so try to be positive about everything and don’t take an entrenched position on anything.

Common Ground!

Another tactic is to actively seek out the interests of your coworkers and really stick to those topics of conversation. If they like sports, try to talk about their favorite teams and players. If they have a hobby like gardening or reading, maybe take an interest in what they are doing or reading.

It’s not that hard to be civil and social with people—everyone has things that he or she likes, and it’s easy to at least feign some level of interest in one of these activities. Talk about current events, pop culture, or what is happening in your local area. Trust me; it’s just easier to stick to the safe subjects than to wade into the waters of contention.

Above all else, just try to be kind to one another. That may sound like something that an elementary school teacher tells their students, but it still rings true at the office. There’s no point making enemies in the place in which you work. There’s nothing worse than hating going to work because you are in a major disagreement with a coworker.

Finally, and this may be tough for some people, if all else fails, be the one who meets in the middle, the one who says, you know what, I’ll suck it up and be wrong about this thing. If you concede a point or simply give in when it comes to an unimportant work issue, you won’t notice an hour after the given interaction, and it will score you big points in the long run.

All you need to know about the Process Performance Metrics

After defining a new Business Process, how can we measure if the daily work is performed as the process definition?

Then we need Performance Metrics or Performance Indicators. The purpose of measuring Performance Metrics is to control whether the Process is executed successfully and meet the goal of the process. If the Business Process Performance is not good, a follow-up gap analysis can be performed for improvement.

Which Performance Characteristics are meaningful to measure?

A Process is aimed at achieving a goal or purpose. Therefore the Performance Metrics will be all about the achievement of the Process’s goal or purpose. There are several classical Performance Characteristics:

Effectiveness – it indicates whether the goal of the Process has been achieved .

Efficiency – it indicates whether the purpose of the Process has been achieved with the minimum resource (time, money).

Quality – it indicates whether the purpose of the Process has been achieved by meeting the quality criteria.

Timeliness – it indicates whether the purpose of the Process has been achieved in time.

Next to these, some industry-related characteristics can be used. For example, for the Offshore Engineering industry, Safety is an essential core value. So there must be a Performance Metric reflecting the Safety characteristic.

What are the basic attributes for a Process Performance Metric?

In order to define a Performance Metric structurally and consistently, let us first define the basic attributes which a Process Performance Metric should have:

  • ID
  • Name
  • Definition
  • Performance Characteristic
  • Measurement Method
  • Input for the Metric Measurement
  • Output Registration
  • Acceptance Value Criteria
  • Target Value

How to define the Performance Metric for a Business Process?

The definition of a Business Process normally consists of the following elements:

  • the goal of the Process
  • sequential Stages and the purpose of each Stage
  • different Activities within each Stage and the purpose of each Activity
  • inputs and outputs of each Stage

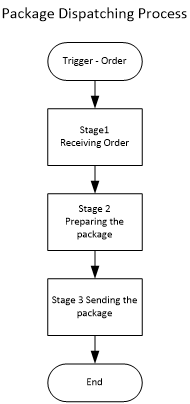
For example, the Package Dispatching Process of a web hand-crafts shop “Hand Made” is like this:

xin 032117 1

The goal of this Process is to send the ordered goods within 24 hours after receiving the Order.

The purpose of Stage 1 is to check the completeness and validity of the Order information: article name, quantity, payment information, client name, billing address, delivery address.

The purpose of Stage 2 is to prepare the package with the specified order.

The purpose of Stage 3 is to arrange the shipping within 24h after receiving the order.

The Process Performance Metrics can be defined either for the whole Process or for each Stage, and even for an Activity. Each Performance Metric represents one or multiple Performance Characteristics.

Continue using the example of the “Hand Made” process; a Performance Metric Example is defined below to show how to define the Performance Metrics on Process and Stage level following the attributes mentioned above:

Example 1 Performance Metric 1 – Effectiveness of the Process

  • ID: M1
  • Name: Effectiveness of the Process
  • Definition: this Metric indicates whether the ordered goods is shipped out within 24 hours after receiving the Order.
  • Performance Characteristic: Effectiveness, Timeliness.
  • Measurement Method: Calculate the difference between the shipping time and the order time.
  • Input for the Metric Measurement: shipping time, order time.
  • Measurement Output Registration: Order Management System.
  • Acceptance Value Criteria: < 24h.
  • Target Value: <22h.

Example 2 Performance Metric 2 – Effectiveness of Stage 1

  • ID: M2
  • Name: Effectiveness of Stage 1
  • Definition: this Metric indicates whether the received order contains complete and valid information: article name, quantity, payment information, client name, billing address, delivery address.
  • Performance Characteristic: Effectiveness
  • Measurement Method: If the completeness and the validity have been checked, rate 2. If only either completeness and validity is checked, rate 1. If none of them is checked, rate 0.
  • Input for the Metric Measurement: Order information
  • Measurement Output Registration: Order Management System
  • Acceptance Value Criteria: 2.
  • Target Value: 2.

How to determine the most important Performance Metrics to measure and monitor?

Since the Performance Metrics can be defined for different characteristics and different levels (Process, Stage, Activity), the total number of Performance Metrics could be huge. It is not realistic to measure and monitor all the possible Performance Metrics. Therefore the Process Owner needs to determine the Key Performance Metrics for the process based on the Business Goal. The Business Goal decides which characteristic of the Performance Metric should be measured. For example, the Business Goal of the Package Dispatching Process is Reduce the total Process time. Then the characteristic Efficiency should be certainly measured. Since the total time is divided into activity level, the performance metrics need to be defined till activity level.

What to do with the measured Performance Metrics?

As mentioned at the beginning, the purpose of measuring the Performance Metrics is to control whether the Process is executed successfully and meet the goal of the process. As part of the Performance Metric Definition, Target and Acceptance Value has been defined. If the Performance Metric does not meet the Target or Acceptance Value, it indicates that the process execution or even the process definition needs to be improved.

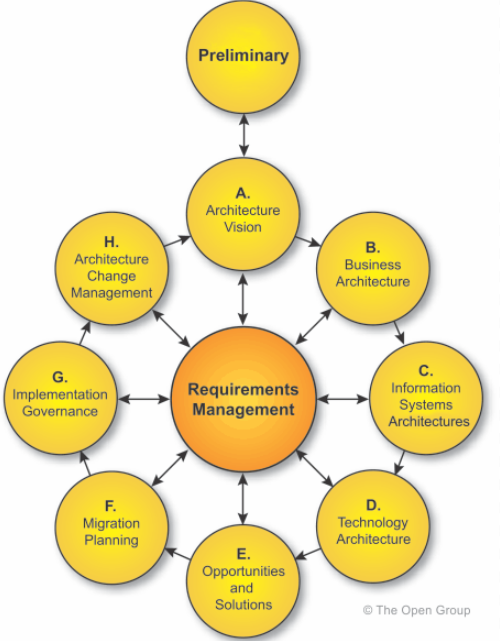
So the follow-up for the measured Performance Metrics would be gap analysis finding out what is the cause of the mismatch and what needs to be improved. The Performance Metrics should be regularly measured and improved continuously in case the result does not reflect the Process Performance explicitly. Following the TOGAF’s Enterprise Architecture Framework, the solution for solving the identified process performance gap will be evaluated, implemented and governed.

Xin 032117 2

In a word, in order to achieve the Business Goal of a Process, define the Performance Metrics, measure them regularly, improve the Process Performance and Performance Metrics continuously!

The Business of Process Analysis

As Business Analysts, we’ve probably all had to map processes. But the question is ‘did we succeed in what we set out to do?’

Process analysis and its subsequent mapping are seemingly very rudimentary business analysis skills. It is something that a Business Analyst should be able to handle even at a fairly junior level. When we set out to perform process analysis do we really understand what we are trying to get out of it and are we properly prepared to deal with whatever the result?
Thinking back over my time as an analyst I can recall quite a few times where I would be doing process analysis in a fully prepared state, or so I thought, but in hindsight, I was doing little more than conducting meetings and doing even less with the results.

So why would we do process analysis in the first place? To understand the AS IS state is one obvious reason. Another common response would be that it needs to be done as part of a contractual deliverable. But even in the absence if these most basic reasons there are many other good reasons why we should be doing it.

Let’s Visualize our World

Doing process analysis and mapping out the results allows all stakeholders to see the bigger picture, and not just their part of it. Whether they like what they see or not is irrelevant. What is relevant is the fact that the bigger picture stirs up a lot of discussions which leads to the second reason why we do it.

Solve the Problem

All the talking and discussions that result from a process map gets the creative juices flowing and not only helps stakeholders to rethink those processes where they knew they were not doing too well but, more importantly, help them rethink those processes that they thought they were doing great.

Identify Functional Gaps

Potentially the most dangerous reason why we do process analysis. I say this because you have the very real danger of exposing functional gaps in your supporting systems during the analysis process. Hopefully, there is room to close these gaps but there is also the danger that they cannot be closed within the scope of an existing project. I mention that it is potentially dangerous but not exposing such gaps can be even worse.

Once you know why you want, or need, to do process analysis and you understand how to manage the possible outfall the rest is fairly simple.

Know Your Stakeholders

Getting to know your stakeholders means that you have an understanding of how they interact and where they fit into the bigger organization.

Select Techniques

People, in general, tend to become set in their ways when they are not actively challenged. Business Analysts are no different so reevaluating your approach and techniques is always a good idea. Sure, the way you have done things in the past worked so don’t fix it if it ain’t broke right? Maybe. But every audience is different and the techniques that you will use needs relatable. Remember that the stakeholders will be (should be) active participants in your analysis process and for somebody to be active they need to be engaged. You cannot engage somebody in something they do not relate to. No matter what techniques you decide on you can improve the efficiency by

  • Conducting Research

Research as an analysis technique is often neglected. Doing research to understand the background of what you are trying to achieve is vital and will give you an important head start. One of the key aspects of facilitating a process analysis workshop is the ability to question everything, but the line of questioning should be aligned with fact. Your research will provide you with these facts. Try to be as unobtrusive as possible when researching and stick to the basics. DO NOT be tempted to skim over something during the workshop sessions because you already KNOW it.

  • Being Agile

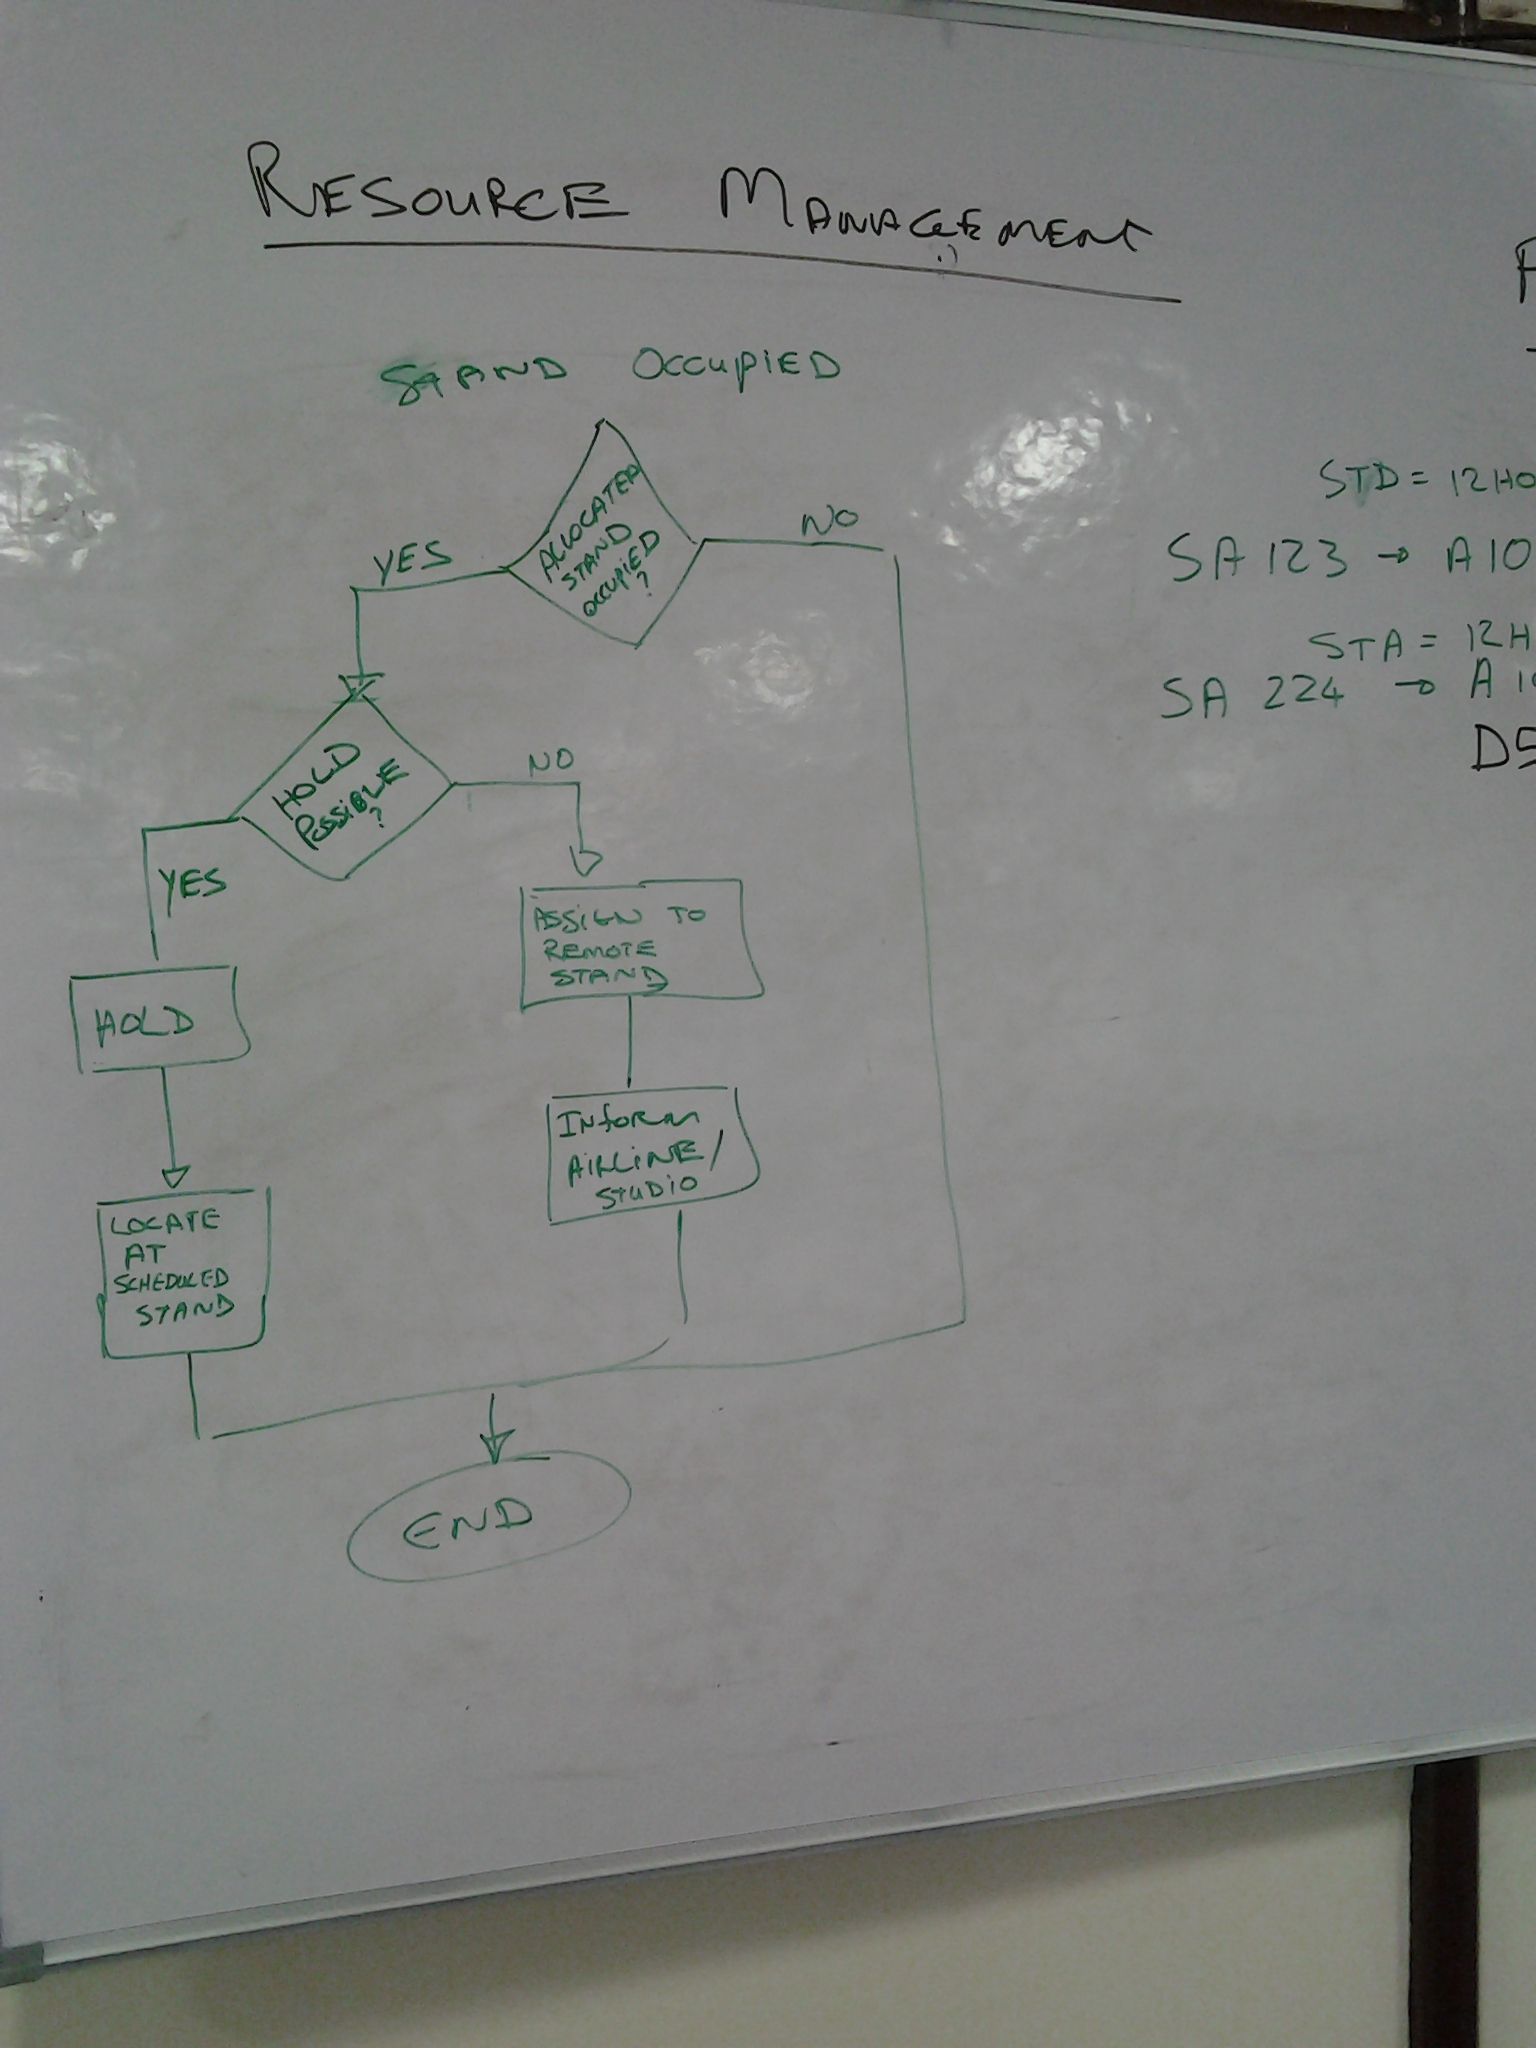
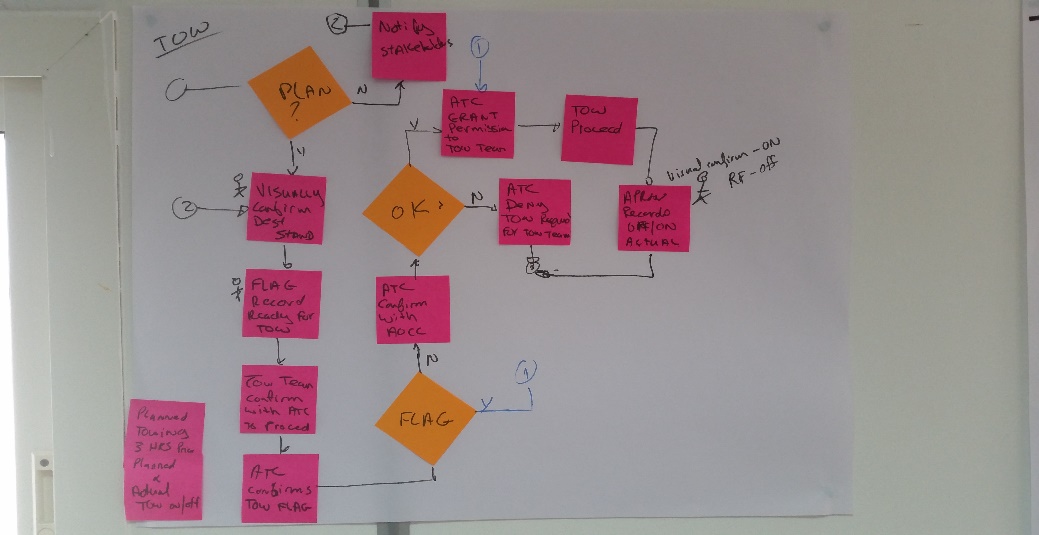
Select a technique that will allow you to be agile. Things can change quickly during a workshop session, and you do not want to be apologizing for spending lots of time fixing or changing something. While a whiteboard allows you to erase or redo anything, it becomes a bit messy when you are at gate 34, and you need to make a change at gate 2. Messy is a fact of life when it comes to process mapping workshops, but it must be a good messy i.e. controlled chaos. I prefer using post-it notes on flip chart pages. Depending on the process I would stick the flip chart page onto a wall and proceed to draw out the process using the post-it notes. The post-it notes allow me to be very agile while the flip chart pages allow me to expand in any direction. While I tend to stick to the more conservative side, the availability of post-it shapes and colours allows you to be very creative.

anton1
VS

anton2

  • Being Comfortable

Stick to techniques that you are comfortable using. Hopefully, as a Business Analyst, you are comfortable in your position as a facilitator but that only gets you to the point where you need to use a technique or tool. Stakeholders can smell blood in the water, especially hostile ones. If you do decide on a technique or tool that you are not 100% comfortable using, then practice until you are. An analysis workshop is not the time to ‘wing’ it.

The Workshop

This is where the rubber meets the road, where all the preparation you have done pays off. You did prepare, right? Who goes into a meeting or workshop as a facilitator and do not prepare? Well, there is prepare, and then there is PREPARE. I’ve done both, and I can tell you that they are not equal. So some pointers when the time comes to show off your skills.

  • Ensure everything works. If you are using a technique that requires that a large open space, make sure the technique is possible in the actual venue. Keep factors like lighting, ventilation, and accessibility in mind.
  • Engage ALL stakeholders. Make sure that the seating positions are arranged to ensure that everybody has an equal opportunity to participate. Remember that they might not even need a table in front of them and even standing in a semi-circle around a chart could work with a small group. Standup meetings have been proven to be a great way to get people going, and keep them going. It can apply to a workshop too.
  • Question everything, well almost. Not only is it a very effective way of engaging stakeholders, but asking questions also makes them think. You did your research so you have some facts that you could use to raise sensible questions.
  • Focus on the AS IS. While it might be very tempting to show off you prowess as a Business Analyst by highlighting shortfalls in the existing processes, it is much more effective to focus on what they are currently doing. The time to fix it will come soon enough. But don’t squash ideas coming from stakeholders. Save these ideas for consideration during the TO BE process designs.

The workshop is done, and you have walked away with a heap of information. It is time to produce the output, probably in the form of an analysis report containing the AS IS and TO BE states for the processes you have mapped. The output is as, if not more important than the actual workshop. While only a select group attended the workshop, the report will find its way to many who were not part of this initial process.

  • Use a format that all stakeholders can relate to and understand. Most people are familiar with the basic flow diagram and decision gateways, so that is a good starting point.
  • Breakdown big processes into smaller sub-processes for easier reading.
  • If your objective was process improvement, make sure that the proposed TO BE state is something that can be supported, either by the project scope or supporting systems.
  • Make sure to spell out clearly what can be achieved and what cannot. You might want to map out TO BE states in a phased approach when the best possible solution cannot be implemented within the current scope constraint.
  • Highlight changes that will have a significant impact on resources. These impacts could be training or hiring needs.
  • Most importantly, produce the output as soon as possible. Do not be tempted to reprioritize activities just because you have taken careful notes of all the proceedings.

And you are done. There are few things as satisfying as delivering a good quality document to stakeholders that they can understand and agree on. The cherry on top is actually implementing the improved process changes. But all this success is only possible if you used the right techniques and tools, prepared properly and produced quality documentation.